Diving Into Data: Class Survey
Understanding the Data Cycle Year 6 Mathematics 60-minute lesson

What is Data?
Information we collect about the world around us Numbers, words, or categories that tell us something Examples: favourite colours, heights, pets, sports
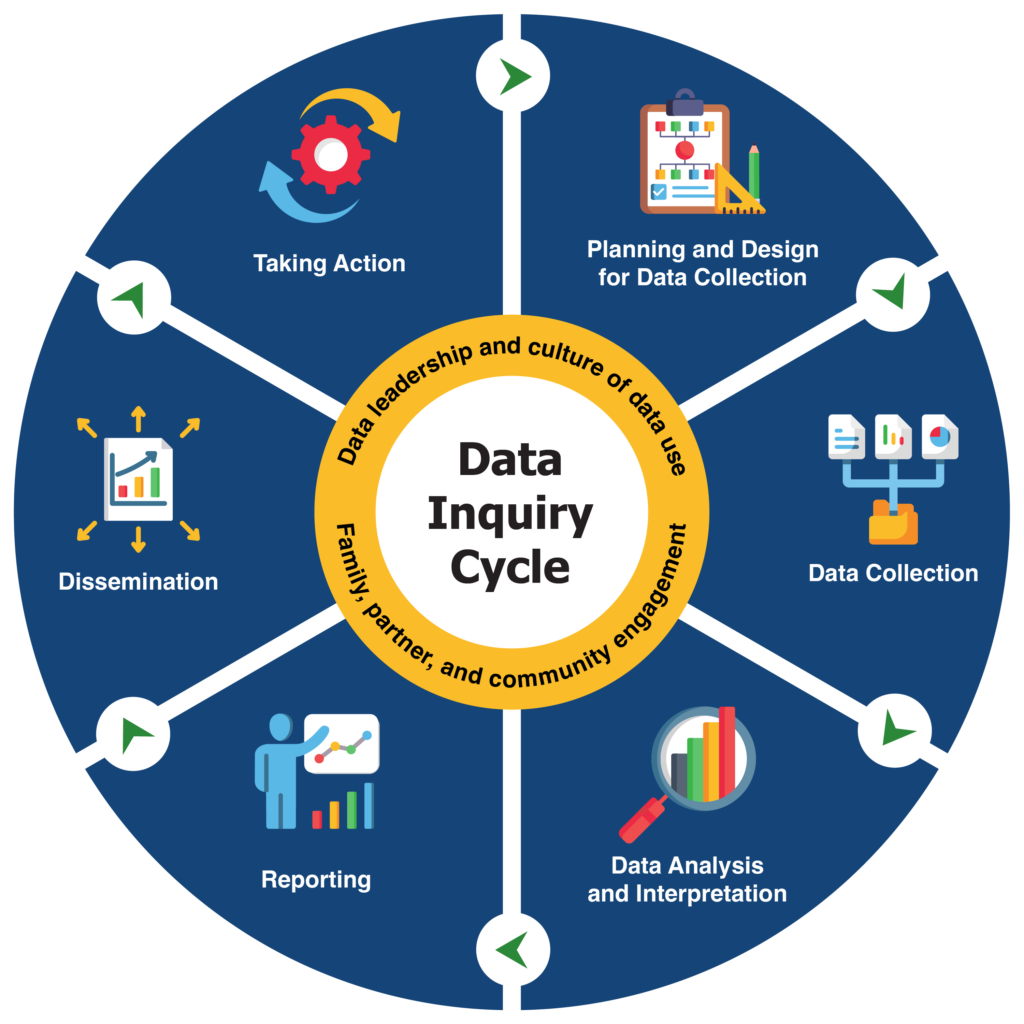
The Data Cycle
Step 1: Ask a Question
Our question must be clear and simple It should have categorical answers (groups/categories) Good example: 'What is your favourite fruit?' Poor example: 'Tell me about yourself'

Design Our Class Survey
Choose our survey question together List possible answer categories Create our survey template Practice asking the question clearly
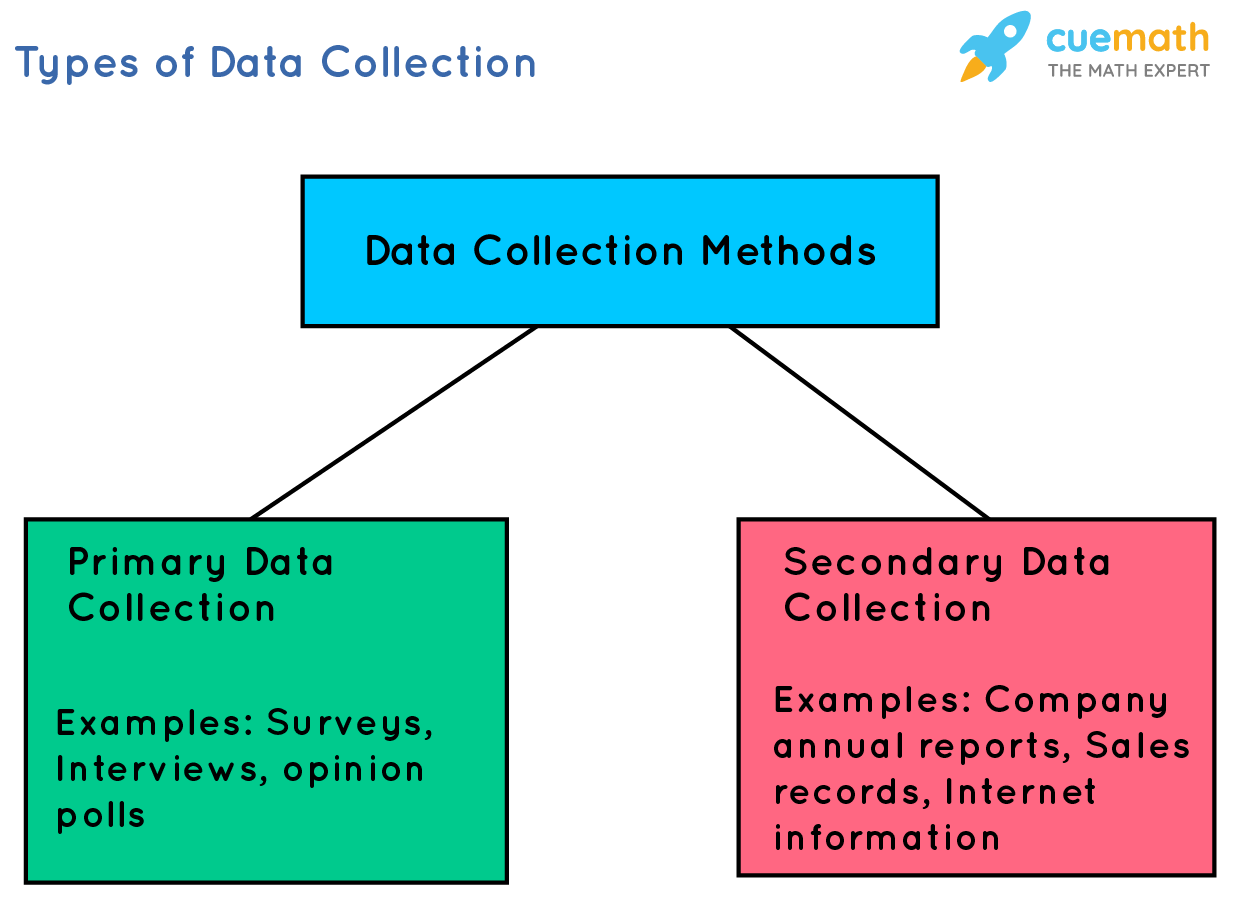
Step 2 & 3: Collect and Organise Data
Move around and ask classmates our question Record answers using tally marks Be respectful and clear when asking Organise tallies into a frequency table
Step 4: Interpret Our Data
{"left":"Which category got the most votes? (This is called the MODE)\nWhich category got the fewest votes?\nWhat does this tell us about our class?","right":"Are there any surprising results?\nHow might this information be useful?\nWhat questions do we still have?"}

Step 5: Share Our Findings
Data helps us understand our world and make better decisions Today we completed our first full data cycle! Next lesson: We'll explore more ways to display and analyse data