
Finding Mean from Frequency Tables
Year 8 Mathematics NSW Curriculum Stage 4 Data Analysis Unit

Learning Objectives
Record data in a frequency table Create and complete an fx column Calculate the mean from frequency tables Use mean to make informed decisions

What is a Frequency Table?
Shows how often each value appears Organizes data into categories Makes large datasets easier to read Essential tool for data analysis
Quick Review: Basic Mean
Calculate the mean of: 5, 7, 3, 9, 6 Step 1: Add all values Step 2: Divide by number of values Answer: 30 ÷ 5 = 6

Sample Frequency Table: Pet Ownership

Understanding the fx Column
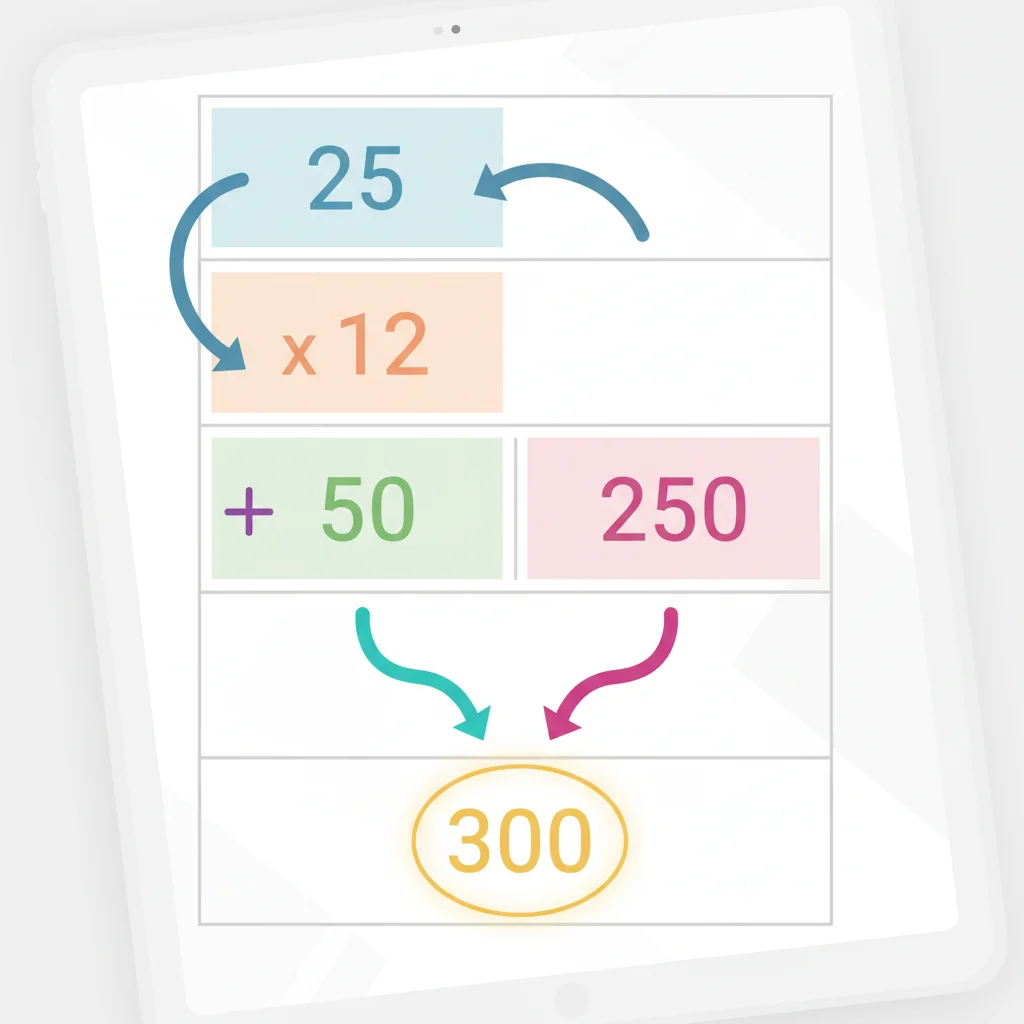
fx means 'frequency times value' Multiply each x value by its frequency This gives us the total for each category Essential step for finding the mean
Let's Calculate fx Together
0 pets: 0 × 8 = 0 1 pet: 1 × 12 = 12 2 pets: 2 × 7 = 14 3 pets: 3 × 3 = 9

The Mean Formula for Frequency Tables
Mean = Σfx ÷ Σf Σfx = sum of all fx values Σf = sum of all frequencies This gives us the weighted average
Calculating Our Example
{"left":"Σfx = 0 + 12 + 14 + 9 = 35\nΣf = 8 + 12 + 7 + 3 = 30","right":"Mean = 35 ÷ 30 = 1.17\nStudents own 1.17 pets on average"}

Think About It
Why is 1.17 pets per student useful information? How could a school use this data? What decisions might this inform?

Your Turn: Practice Problem
Hours of TV watched per day 0 hours: 4 students 1 hour: 8 students 2 hours: 6 students 3 hours: 2 students
Key Points to Remember
Frequency tables organize large datasets fx column multiplies value by frequency Mean = Σfx ÷ Σf for frequency tables Use means to make informed decisions