Graphing Real-World Data Collection Methods
Year 12 Mathematics NSW Curriculum Understanding Data Collection & Visual Representation
Why Collect Real-World Data?
Makes mathematics relevant and meaningful Develops critical thinking skills Connects classroom learning to everyday life Prepares for future careers in data-driven fields
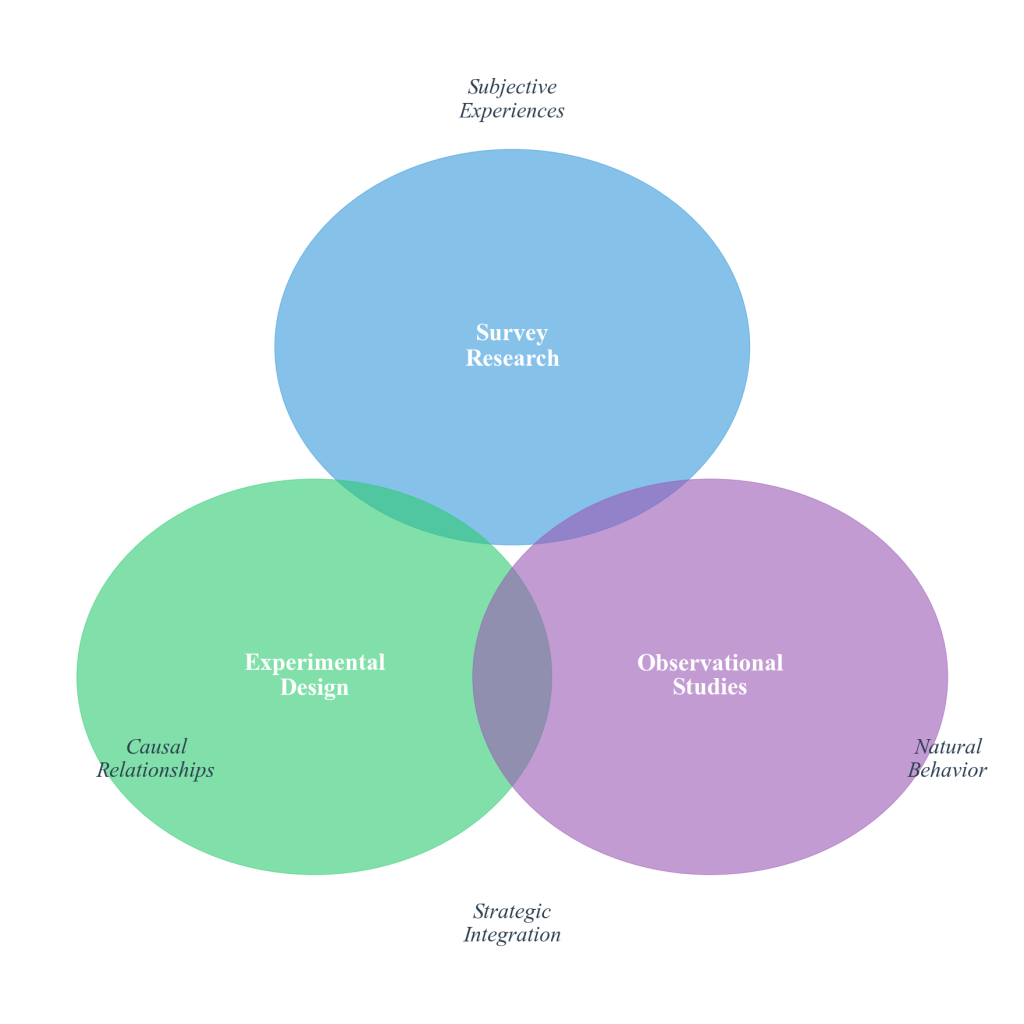
Data Collection Methods
{"left":"Surveys and questionnaires\nDirect observation\nExperiments and testing\nDigital sensors and tracking","right":"Interviews and focus groups\nExisting records and databases\nSampling techniques\nOnline data gathering"}
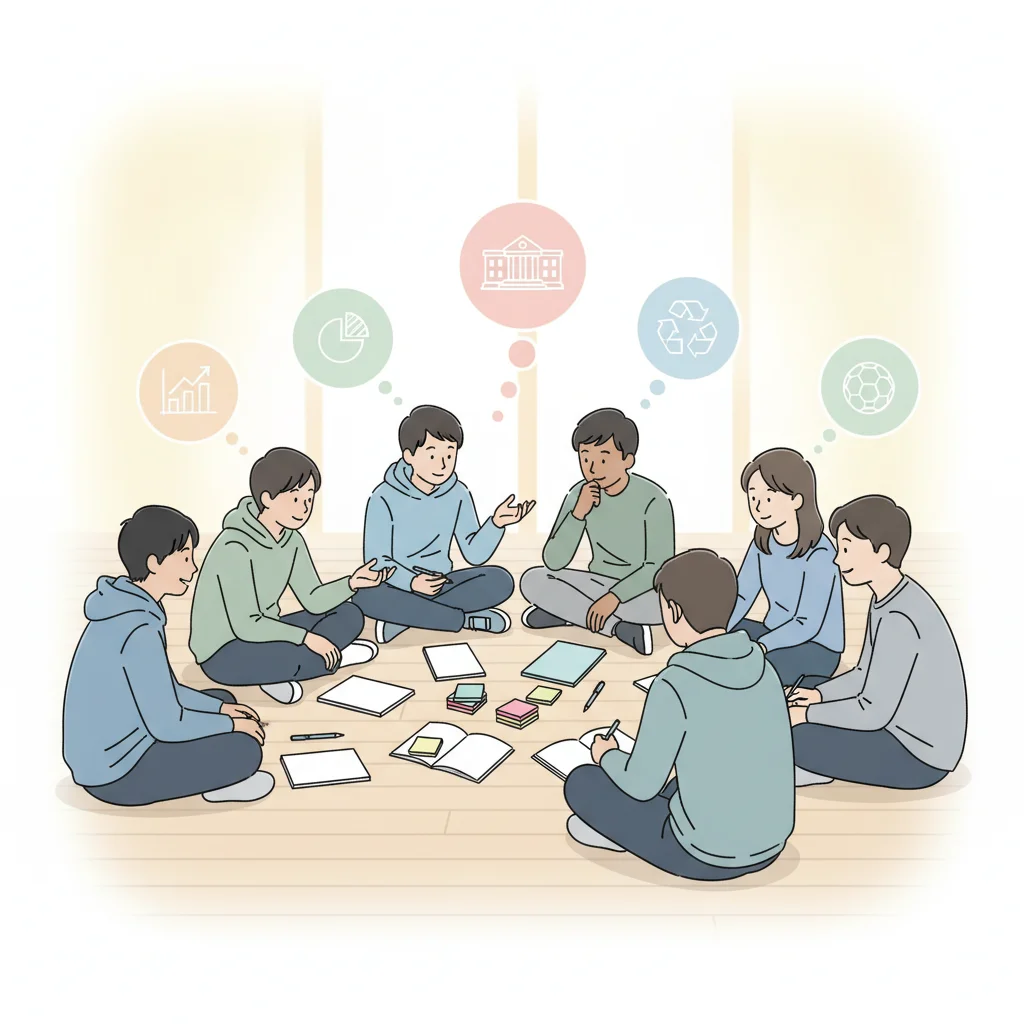
Brainstorming Session: Your Data Project
Work in pairs to identify 2-3 potential data collection topics Consider your school or local community environment Think about what data would be interesting and accessible Examples: canteen sales, library usage, sports participation, recycling habits
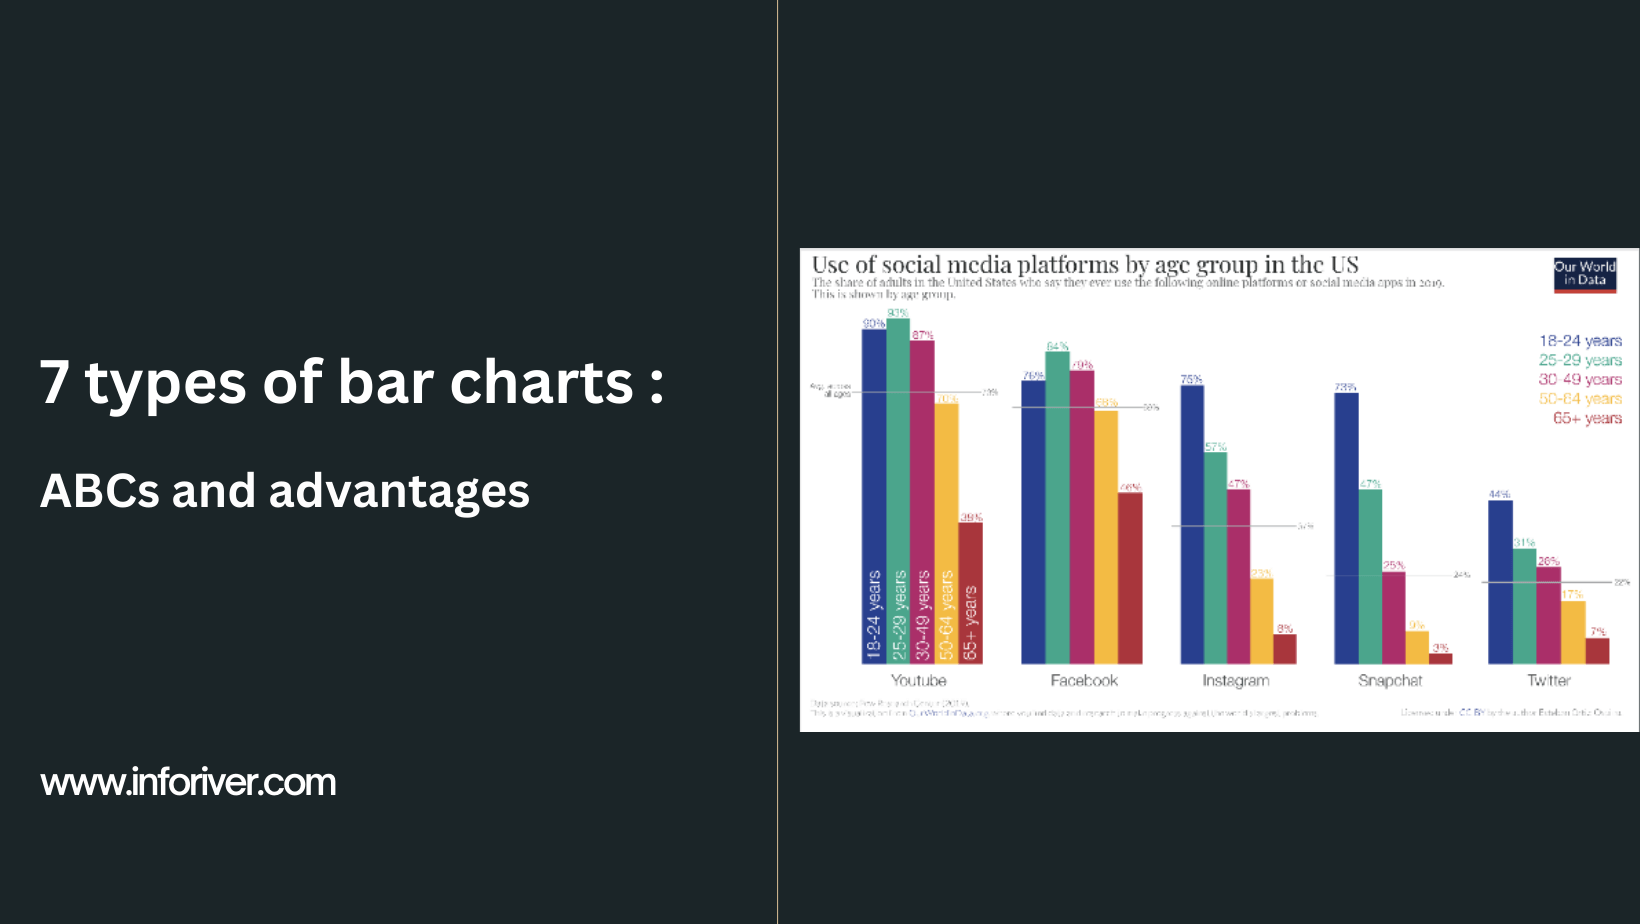
Types of Graphs for Data Representation
Bar Graphs: Compare categories or groups Line Graphs: Show trends over time Pie Charts: Display parts of a whole Each type tells a different story with your data
Which Graph Would You Choose?
Scenario 1: Student club membership numbers across different clubs Scenario 2: Average temperature in your city over 12 months Scenario 3: How students travel to school (car, bus, walk, bike) Discuss with your neighbor and justify your choices
Data Accuracy & Reliability
"The goal is to turn data into information, and information into insight." - Carly Fiorina Key considerations: Sample size matters Avoid bias in collection methods Check for errors and inconsistencies Consider the source and context
Your Next Steps
Finalize your data collection topic Choose appropriate collection method Select the best graph type for your data Plan your data gathering process Consider accuracy and reliability factors