Open vs Closed Energy Systems
Understanding Energy Transfer Year 9 Physics NSW Curriculum
What Do You Think?
Look around the classroom Can you identify systems where energy might be transferred to the surroundings? What about systems where energy stays constant?
:max_bytes(150000):strip_icc()/main-energy-forms-and-examples-609254-v3-5b562a0cc9e77c0037514831.png)
What is an Energy System?
A collection of objects or processes that can store, transfer, or transform energy Has defined boundaries that separate it from its surroundings Energy can exist in many forms: kinetic, potential, thermal, electrical Examples: a bouncing ball, a cup of hot coffee, a battery-powered device
Open vs Closed Systems Overview
{"left":"Open System: Energy and matter can cross the boundary\nMass can enter or leave the system\nTotal energy of the system can change\nEnergy is transferred to surroundings","right":"Closed System: Only energy can cross the boundary\nMass stays constant within the system\nTotal energy remains constant\nNo energy transfer to surroundings"}

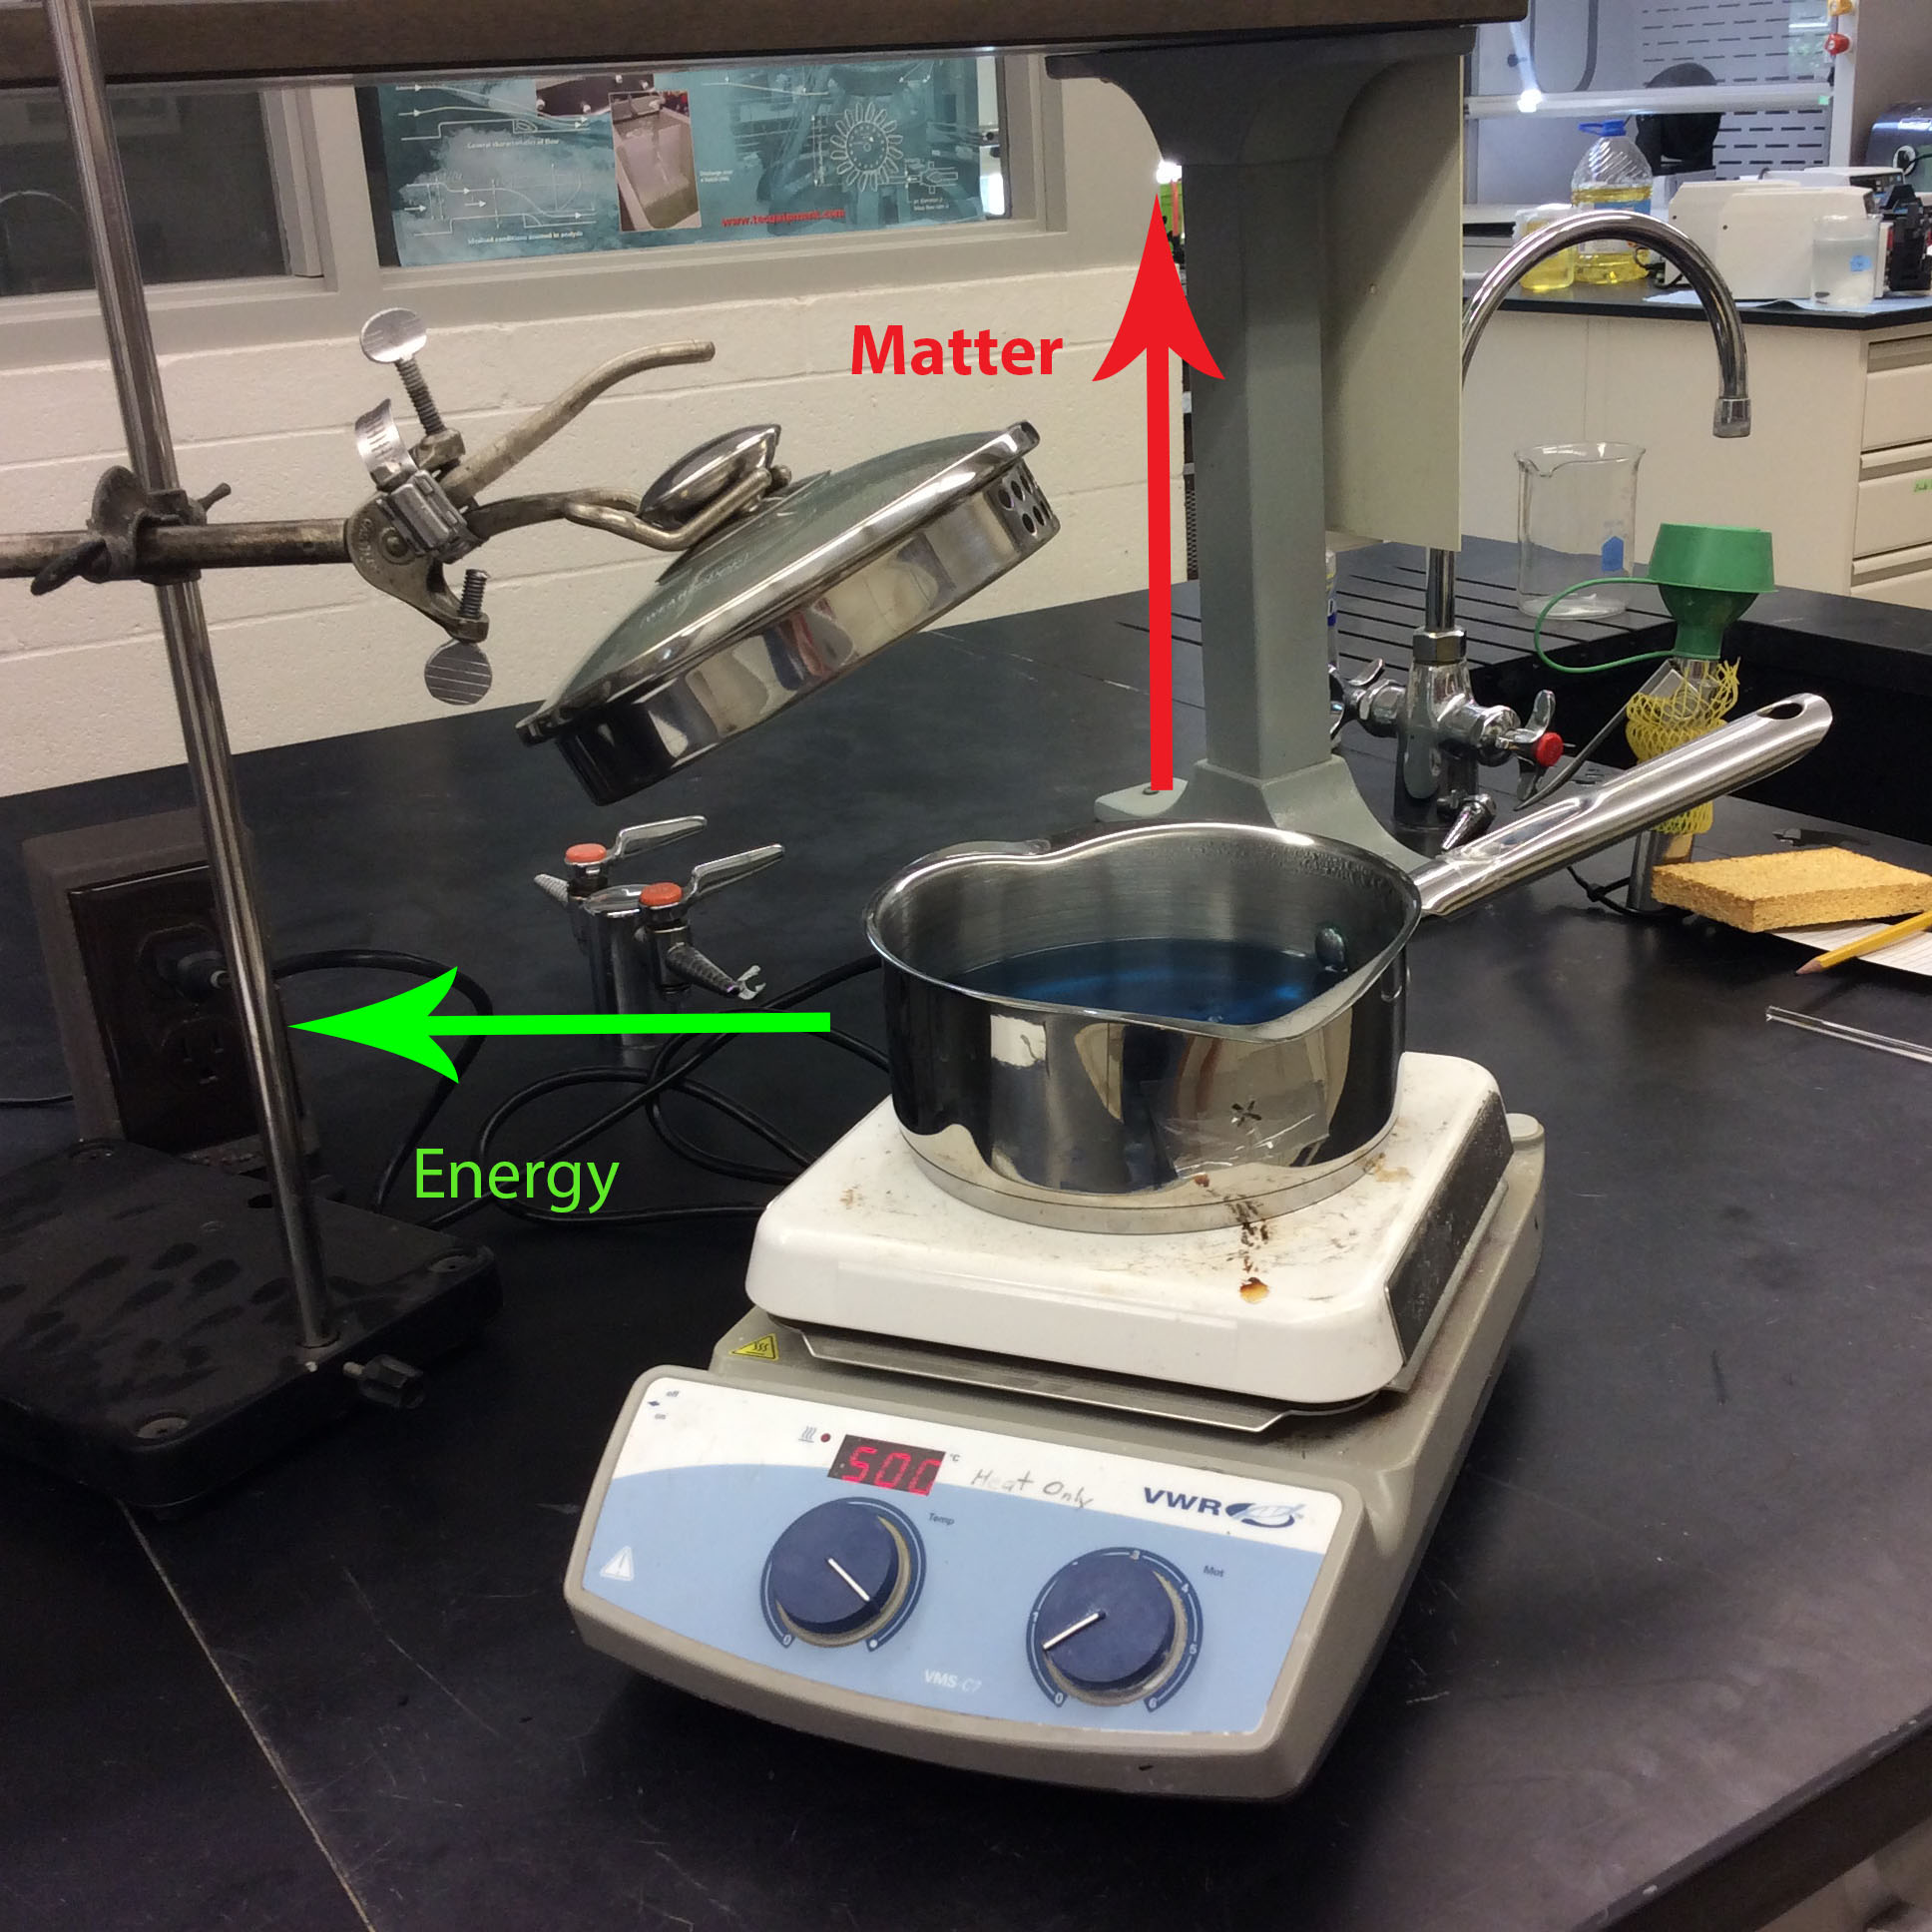
Open Energy Systems
Mass and energy can be transferred to surroundings Total energy of the system CAN change Energy is not conserved within the system boundary Examples: a car engine, a person exercising, a campfire

Open System Investigation
Work in pairs Choose one open system from: smartphone, electric kettle, or human body List 3 ways energy enters the system List 3 ways energy leaves the system Draw arrows showing energy flow
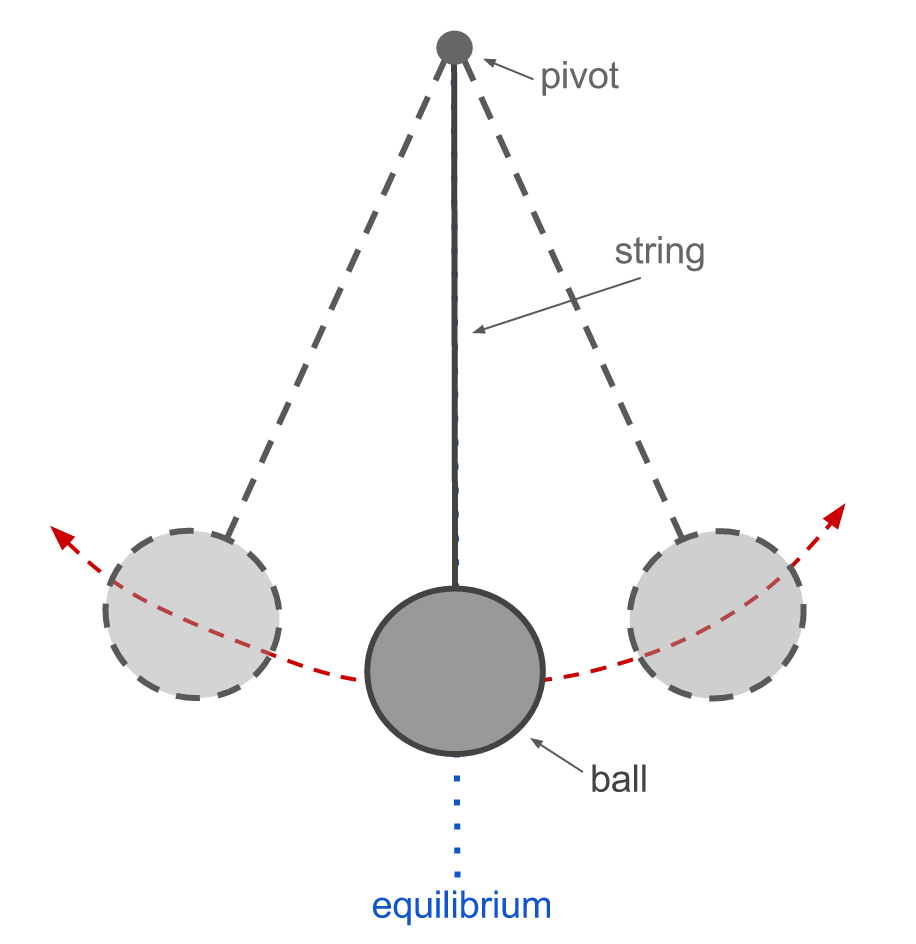
Closed Energy Systems
Energy is NOT transferred to the surroundings Total energy of the system remains CONSTANT Energy is conserved within the system boundary Energy can still transform between different types Examples: a pendulum in a vacuum, a perfectly insulated thermos

Energy Flow Chart Example

Work-Energy Bar Charts
Visual tool to show energy transformations quantitatively Each bar represents different types of energy Height of bar shows amount of energy Total energy conserved in closed systems Total energy decreases in open systems
Create Your Own Bar Chart
Scenario: A 2kg ball dropped from 10m height Calculate: PE at top = mgh = 2 × 10 × 10 = 200J Draw bar chart showing energy at: • Top of drop (all PE) • Halfway down (PE + KE) • Just before hitting ground (all KE)
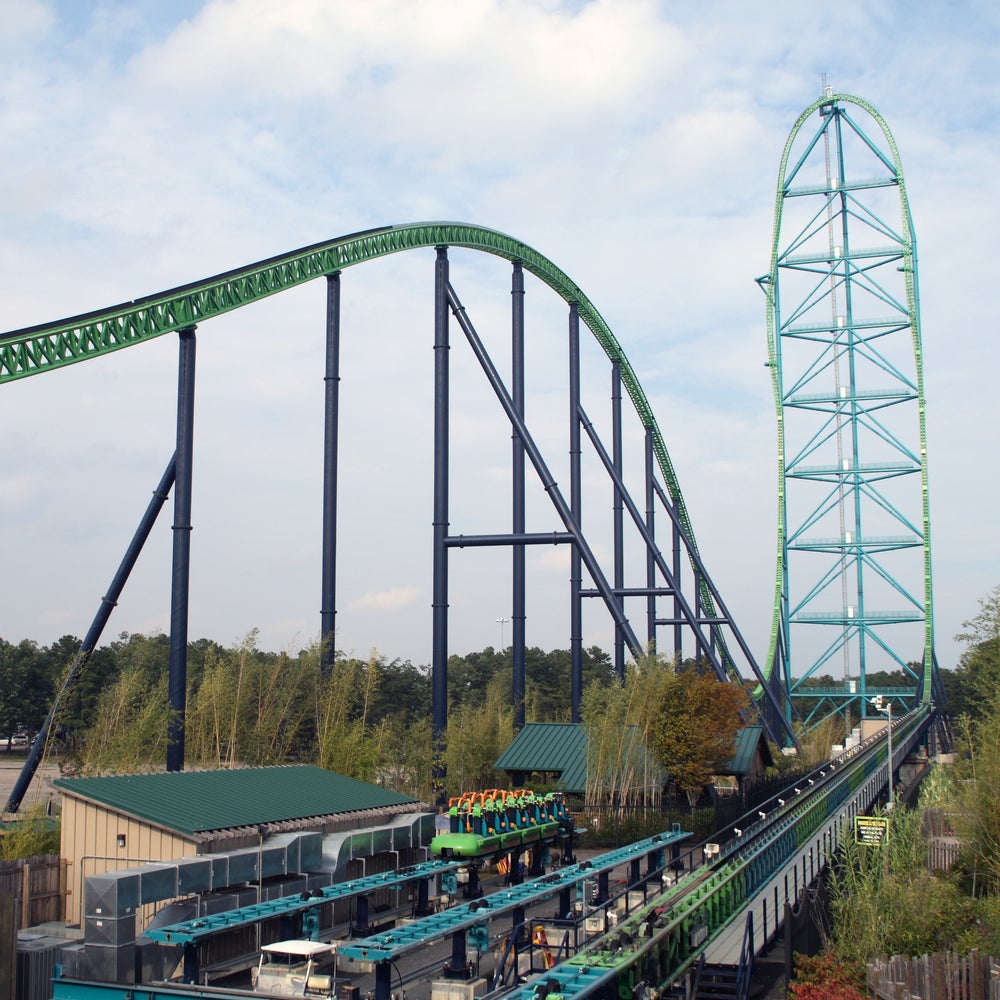
Real World Application
A roller coaster car starts at the top of a 50m hill Is this an open or closed system? What happens to the energy as the car moves? Why doesn't the car reach the same height on the next hill?
Summary: Key Concepts
Open systems: energy and mass can transfer to surroundings Closed systems: total energy remains constant Energy flow charts track energy transformations Bar charts show quantitative energy changes Real systems are usually open due to friction and heat loss