Reading Graphs and Tables
Year 8 Mathematics Exploring Data and Probability
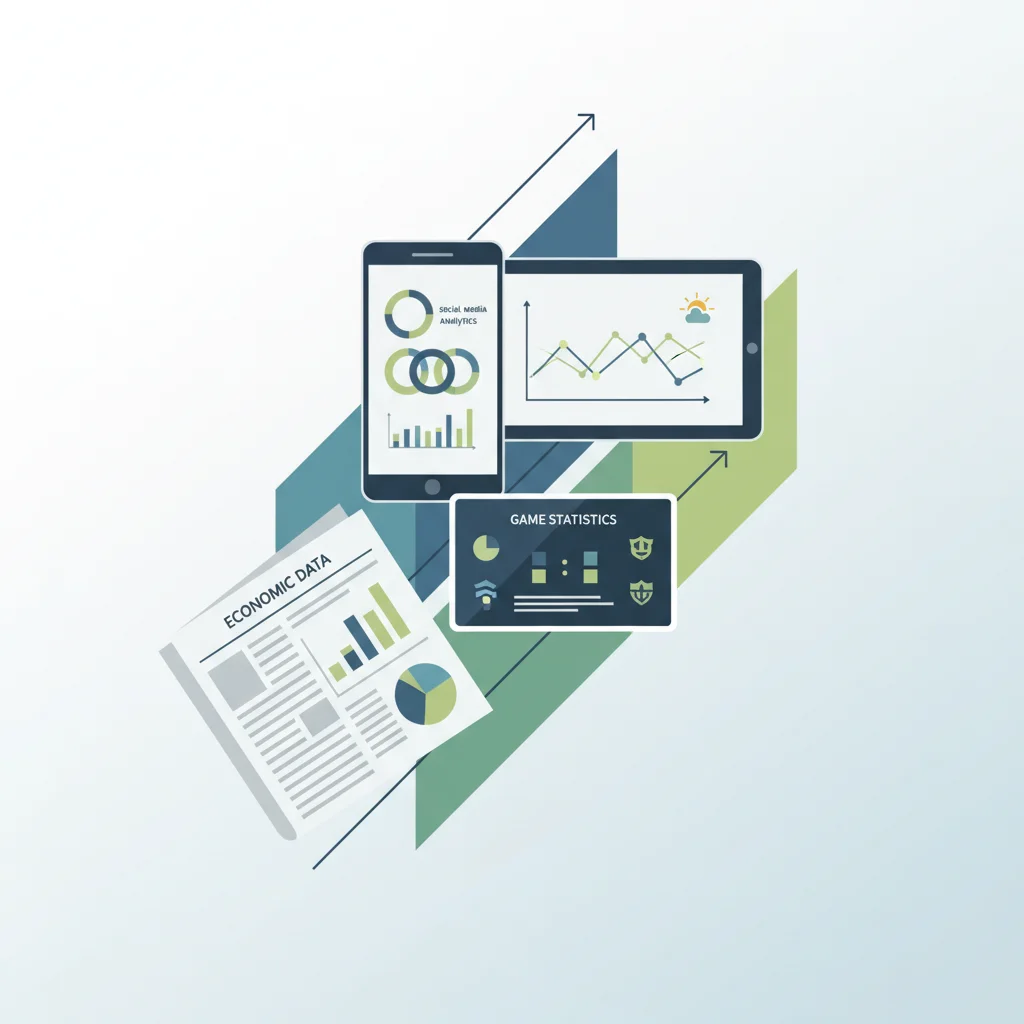
Where Do You See Graphs in Real Life?
Think about your daily life... Social media statistics Weather reports Sports scores News articles

Components of Graphs
Title - tells us what the graph shows Axes - horizontal (x) and vertical (y) lines Labels - describe what each axis represents Scale - shows the units and intervals Legend/Key - explains symbols or colors
Types of Graphs and Their Uses
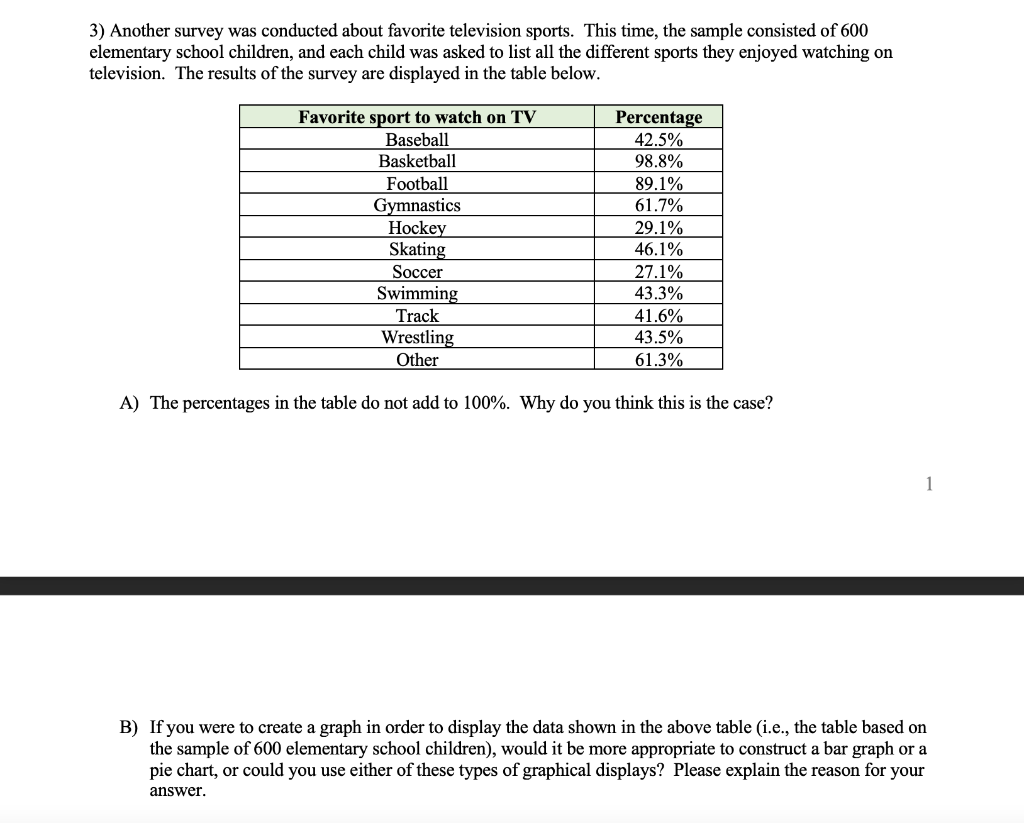
{"left":"Bar Graphs - compare categories or groups\nLine Graphs - show changes over time","right":"Pie Charts - show parts of a whole\nTables - organize data in rows and columns"}

Group Investigation Activity
Work in groups of 5-6 students Each group gets a different graph or table Identify ALL components of your graph Answer 3 interpretation questions Use sticky notes to annotate
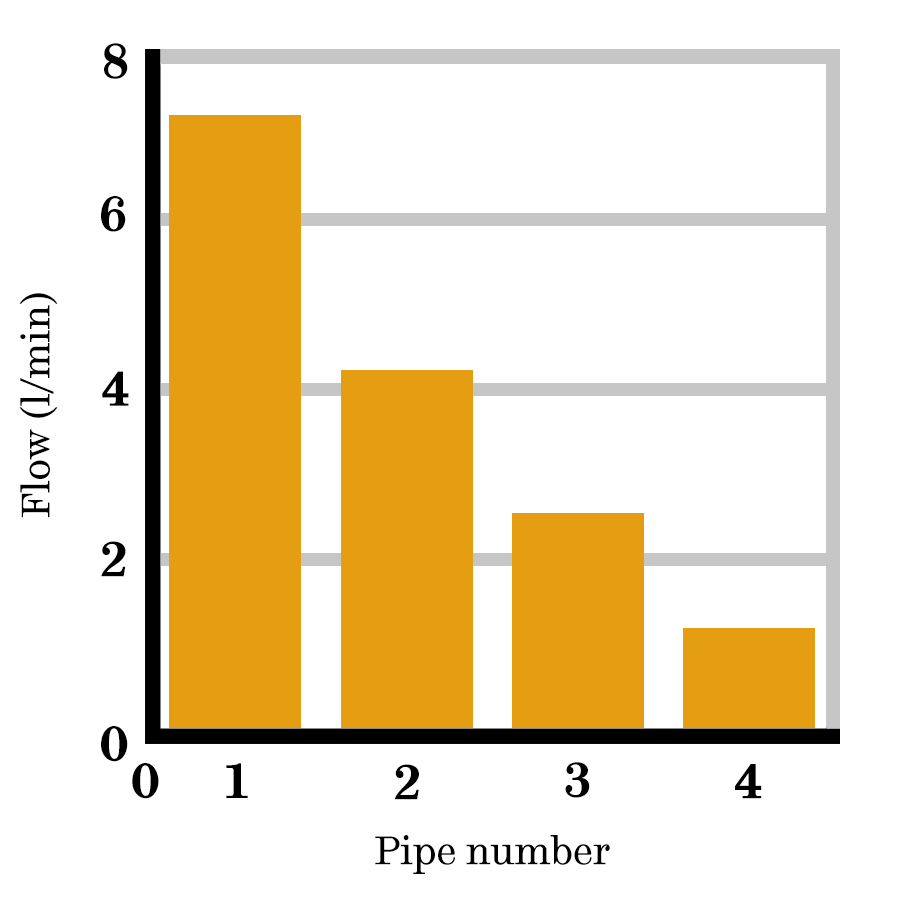
Reading a Bar Graph Example
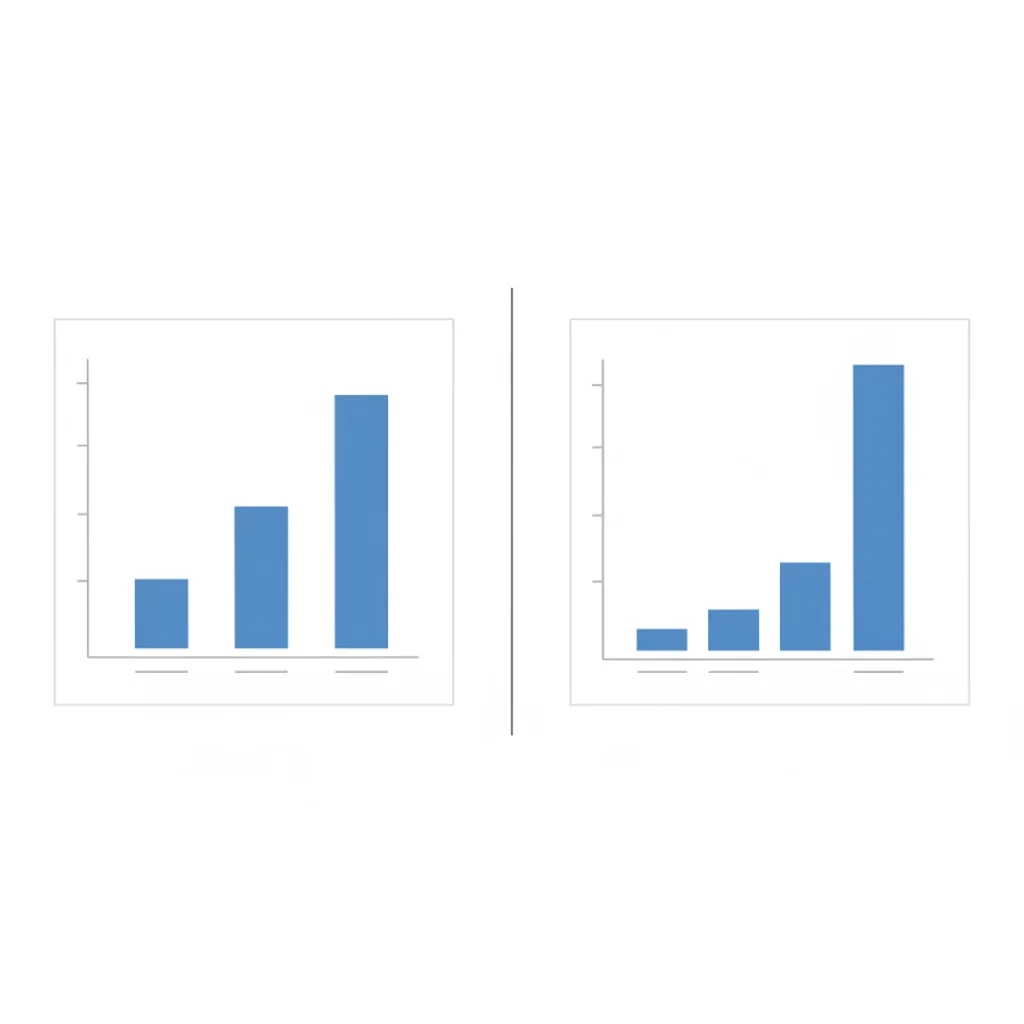
What Makes a Graph Misleading?
Missing or unclear labels Inappropriate scale or intervals No title or source Cherry-picked data Confusing colors or symbols
Key Takeaways
Always check for title, axes, labels, and scale Different graph types suit different data Tables provide exact values, graphs show patterns Question unclear or missing information Practice makes perfect!