Data Relationships Insight
A free maths worksheet ready for your classroom. Open in Kuraplan to grab the print-ready PDF, customize it for your students, or generate a fresh version in seconds.
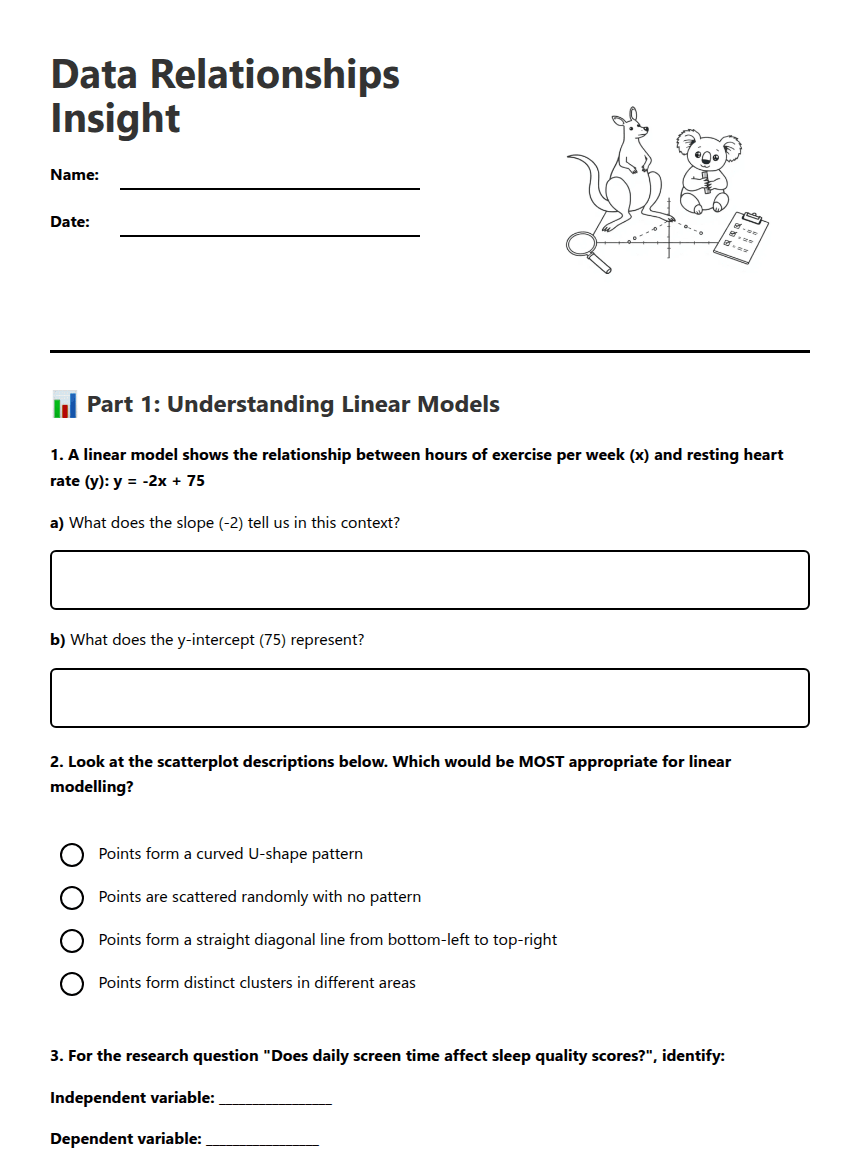
Data Relationships Insight
📊 Part 1: Understanding Linear Models
a) What does the slope (-2) tell us in this context?
b) What does the y-intercept (75) represent?
Independent variable: _________________
Dependent variable: _________________
Expected direction of association: _________________ (positive/negative/none)
🔍 Part 2: Data Collection and Ethics
1. ________________________________________________
2. ________________________________________________
The three characteristics are: __________, __________, and __________.
🎯 Part 3: Application and Extension
About This Worksheet
Free in Kuraplan
Sign up free, grab the PDF, and customize it for your class.
Print-Ready
Formatted for standard paper. Clean layout, easy to read.
AI-Generated
Created with Kuraplan's AI, designed for real classroom use.
For Teachers & Parents
Use in classrooms, for homework, tutoring, or homeschool.
Need a custom version of this worksheet?
Kuraplan's AI generates custom worksheets in seconds — differentiated for every learner, aligned to your curriculum.
Generate Custom Worksheets — FreeMore Maths Worksheets
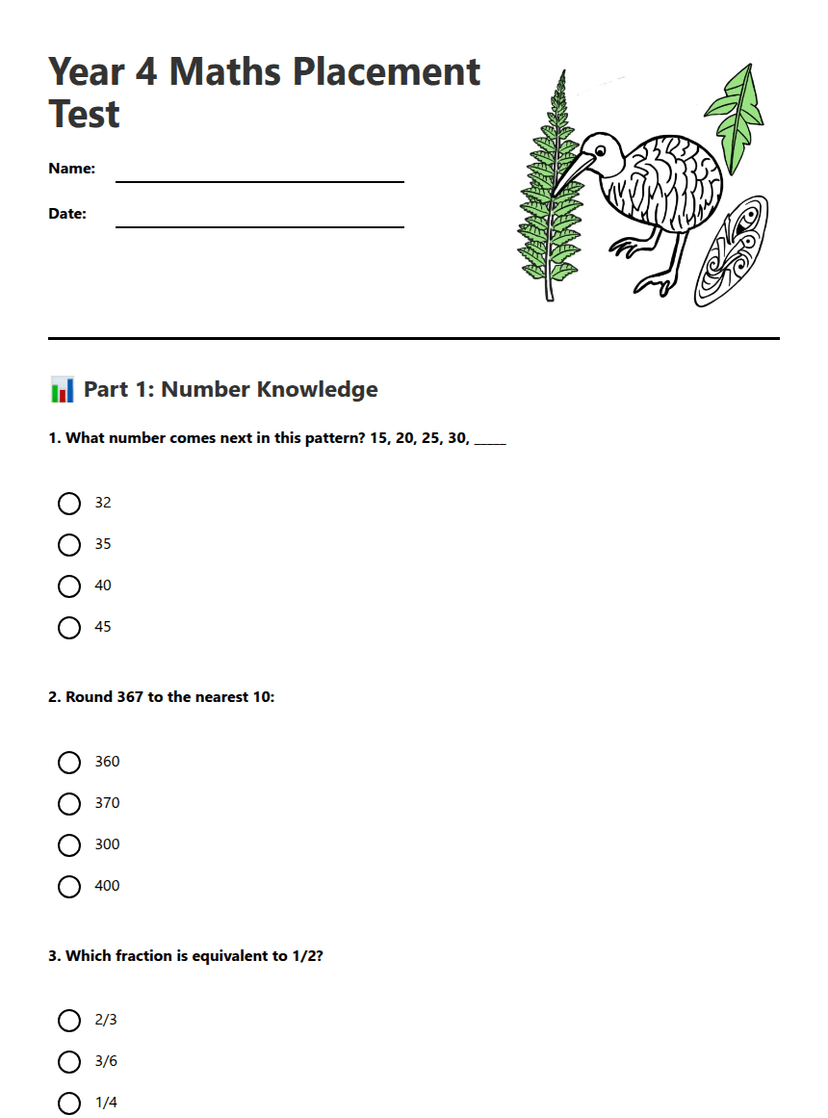
Year 4 Maths Placement Test
Free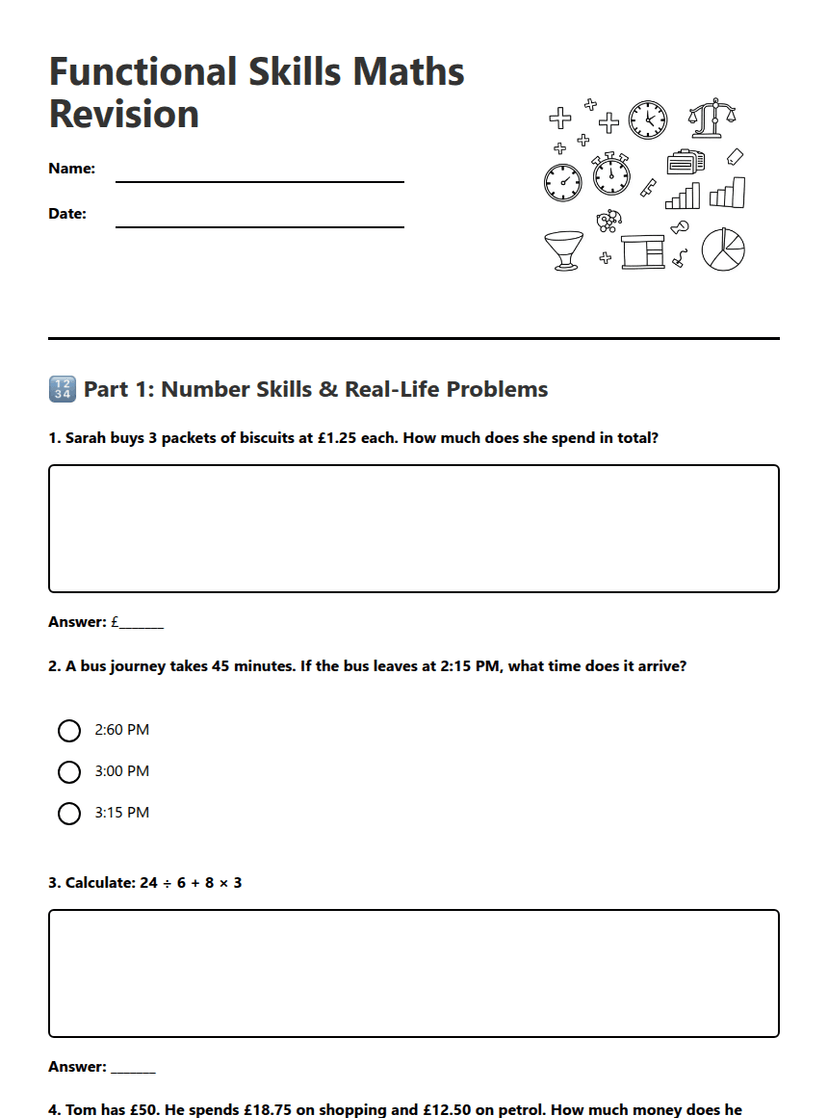
Functional Skills Maths Revision
Free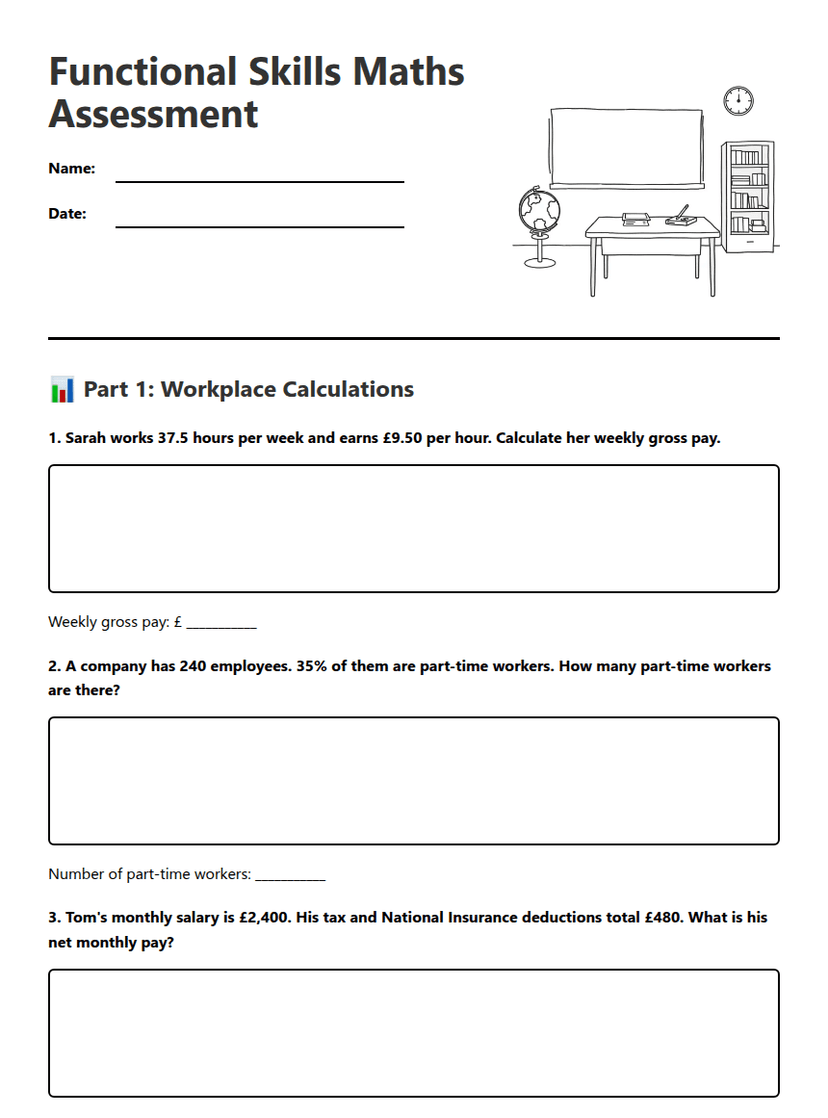
Functional Skills Maths Assessment
Free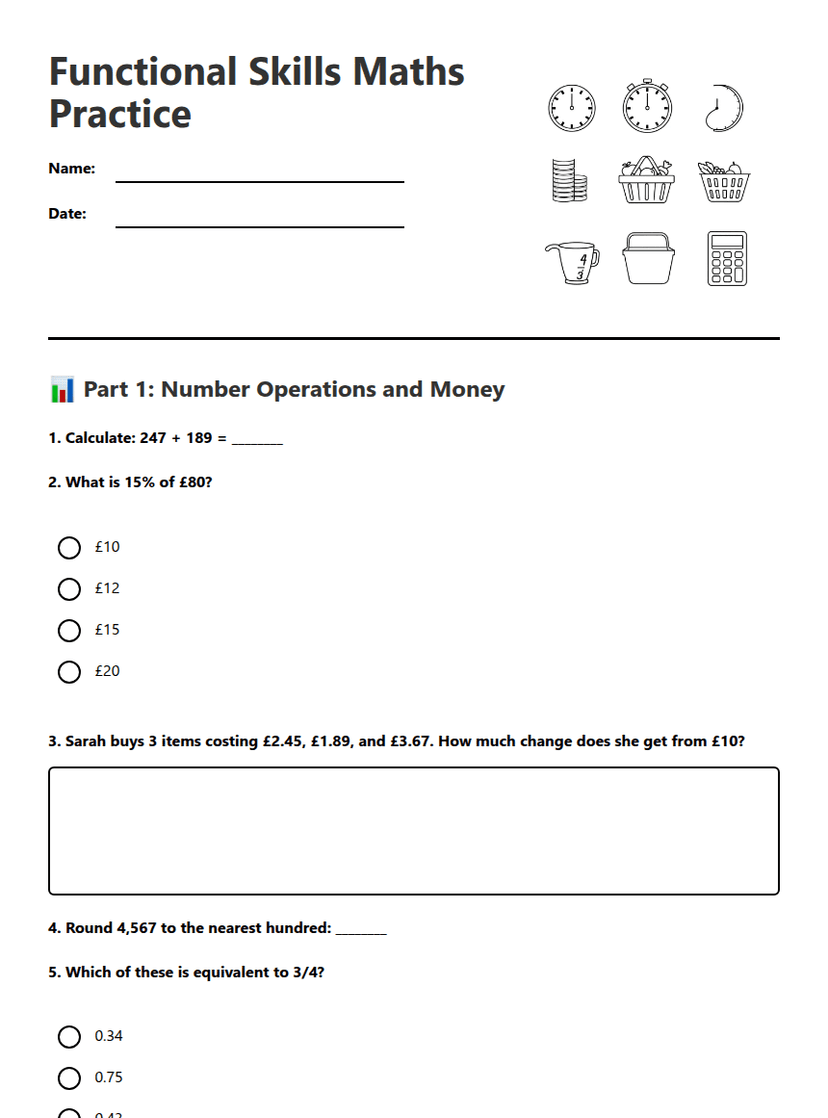
Functional Skills Maths Practice
Free
Maths Trivia Team Challenge
Free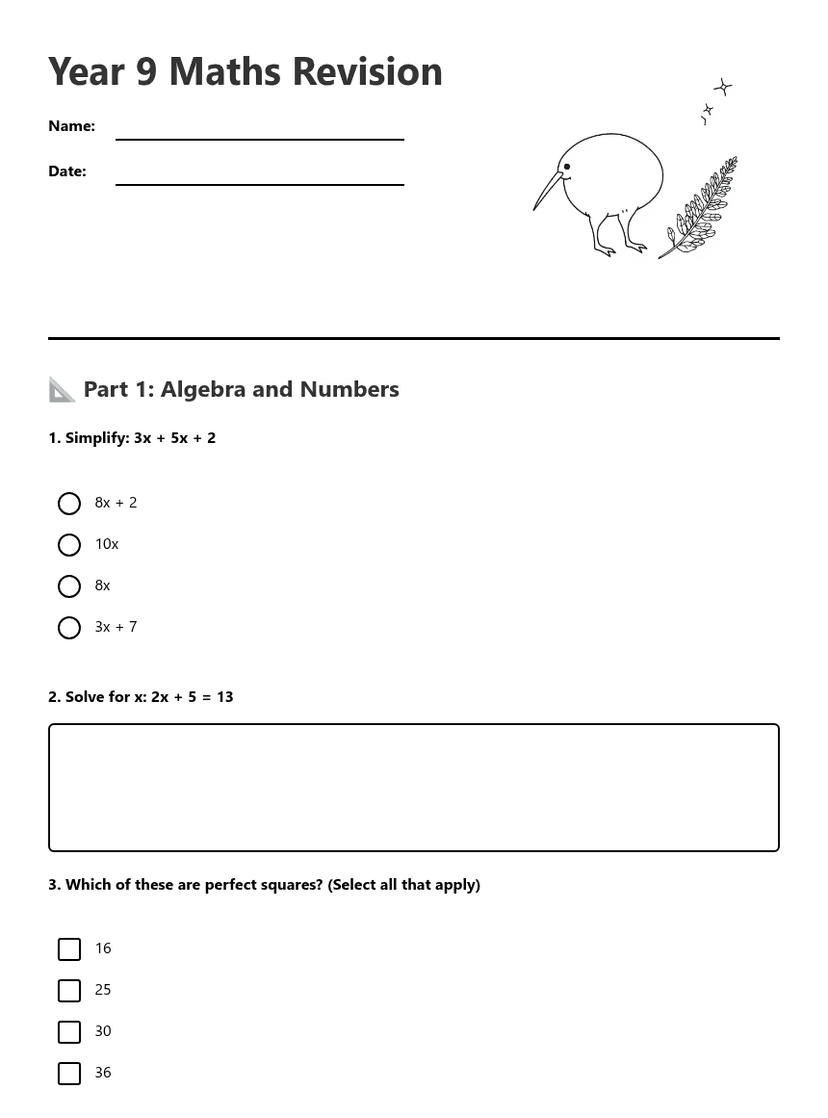
Year 9 Maths Revision
Free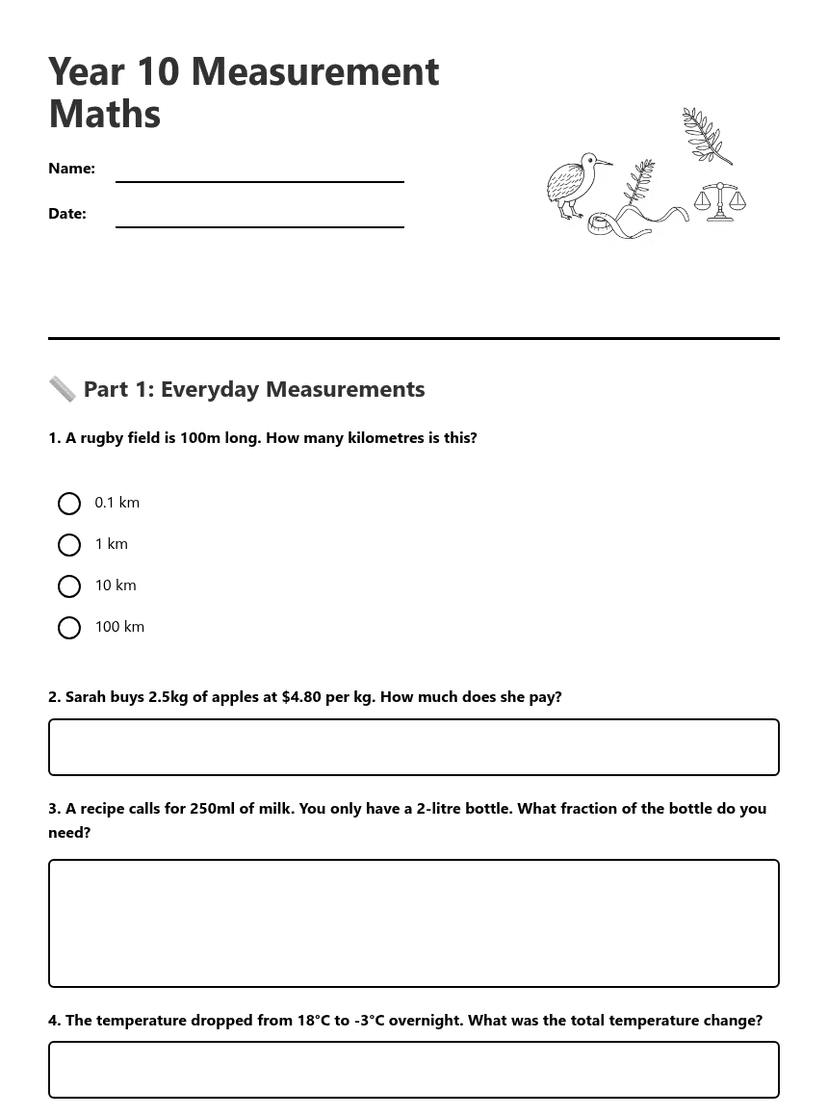
Year 10 Measurement Maths
Free