ScienceFreePrintable
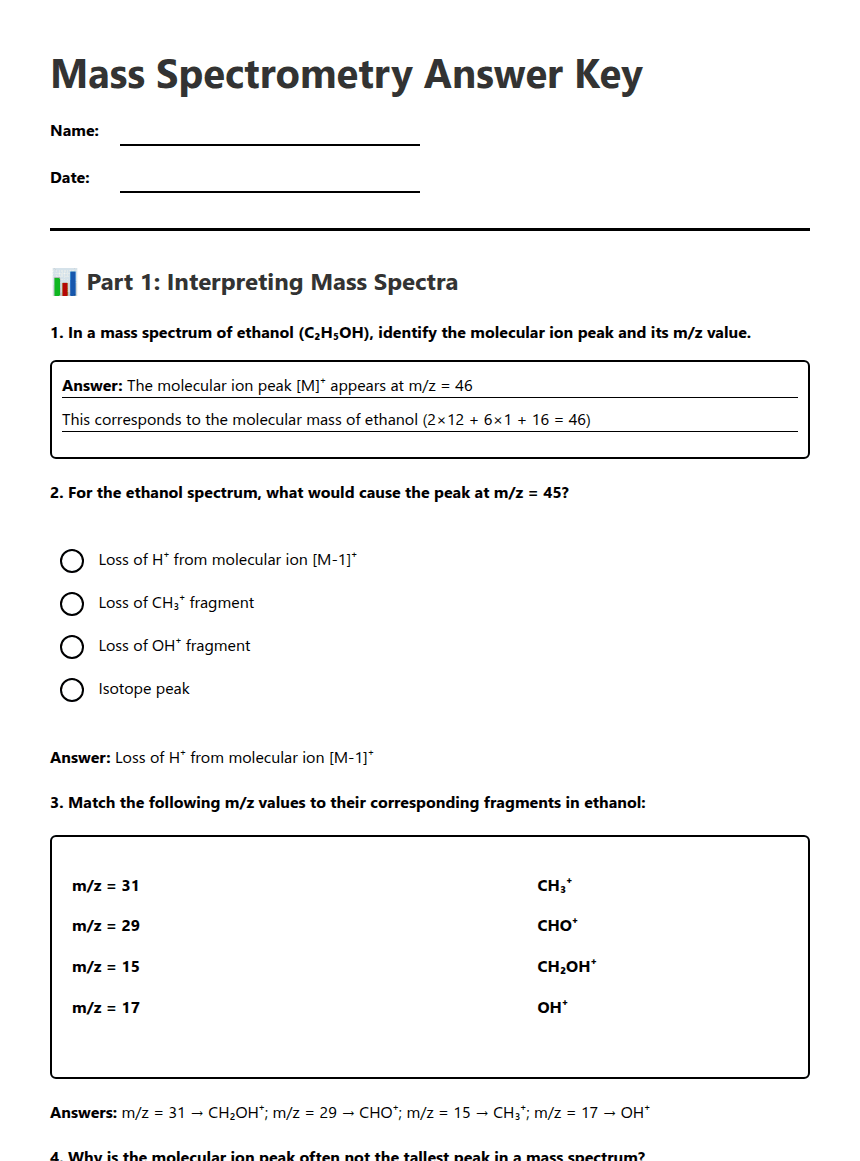
Mass Spectrometry Answer Key
A free science worksheet ready for your classroom. Open in Kuraplan to grab the print-ready PDF, customize it for your students, or generate a fresh version in seconds.
Mass Spectrometry Answer Key
📊 Part 1: Interpreting Mass Spectra
1. In a mass spectrum of ethanol (C₂H₅OH), identify the molecular ion peak and its m/z value.
Answer: The molecular ion peak [M]⁺ appears at m/z = 46
This corresponds to the molecular mass of ethanol (2×12 + 6×1 + 16 = 46)
2. For the ethanol spectrum, what would cause the peak at m/z = 45?
Loss of H⁺ from molecular ion [M-1]⁺
Loss of CH₃⁺ fragment
Loss of OH⁺ fragment
Isotope peak
Answer: Loss of H⁺ from molecular ion [M-1]⁺
3. Match the following m/z values to their corresponding fragments in ethanol:
m/z = 31
m/z = 29
m/z = 15
m/z = 17
CH₃⁺
CHO⁺
CH₂OH⁺
OH⁺
Answers: m/z = 31 → CH₂OH⁺; m/z = 29 → CHO⁺; m/z = 15 → CH₃⁺; m/z = 17 → OH⁺
4. Why is the molecular ion peak often not the tallest peak in a mass spectrum?
Answer: The molecular ion is often unstable and fragments readily
into smaller, more stable ions. These fragment ions may be more
abundant, making their peaks taller than the molecular ion peak.
🔬 Part 2: Worked Example Analysis
5. A compound with molecular formula C₄H₈O shows peaks at m/z = 72, 57, 43, 29, and 15. Identify each peak.
m/z = 72: Molecular ion [M]⁺ (C₄H₈O)
m/z = 57: [M-15]⁺ - loss of CH₃ group
m/z = 43: CH₃CO⁺ (acetyl ion) or C₃H₇⁺
m/z = 29: CHO⁺ (formyl ion) or C₂H₅⁺
m/z = 15: CH₃⁺ (methyl ion)
This fragmentation pattern suggests butanone (methyl ethyl ketone)
6. Calculate the relative molecular mass for a compound showing a molecular ion peak at m/z = 88.
Answer: Mr = 88 (the m/z value of the molecular ion peak equals the relative molecular mass)
7. A mass spectrum shows an M+1 peak that is 4.4% the height of the molecular ion peak. How many carbon atoms are present?
Working: Each carbon contributes ~1.1% to M+1 peak
Number of carbons = 4.4% ÷ 1.1% = 4
Answer: 4 carbon atoms
Number of carbons = 4.4% ÷ 1.1% = 4
Answer: 4 carbon atoms
📈 Part 3: Peak Identification Practice
8. Which of the following factors affect the intensity of peaks in mass spectrometry?
Stability of the ion
Probability of fragmentation
Isotope abundance
Temperature of the sample
Answers: Stability of the ion, Probability of fragmentation, and Isotope abundance are correct
9. Explain why the base peak in a mass spectrum is set to 100% relative intensity.
Answer: The base peak is the most abundant ion in the spectrum.
Setting it to 100% allows all other peaks to be expressed as
percentages relative to this most intense peak for comparison.
10. A hydrocarbon shows peaks at m/z = 86, 71, 57, 43, and 29. Suggest the molecular formula and identify the base peak if m/z = 43 is the tallest.
Molecular formula: C₆H₁₄ (Mr = 86)
Base peak: m/z = 43 (C₃H₇⁺)
Other fragments: m/z = 71 [M-15]⁺, m/z = 57 [M-29]⁺,
m/z = 29 (C₂H₅⁺). This suggests a branched alkane like 2-methylpentane.
About This Worksheet
Free in Kuraplan
Sign up free, grab the PDF, and customize it for your class.
Print-Ready
Formatted for standard paper. Clean layout, easy to read.
AI-Generated
Created with Kuraplan's AI, designed for real classroom use.
For Teachers & Parents
Use in classrooms, for homework, tutoring, or homeschool.
Need a custom version of this worksheet?
Kuraplan's AI generates custom worksheets in seconds — differentiated for every learner, aligned to your curriculum.
Generate Custom Worksheets — Free No credit card Curriculum-aligned Under 60 seconds
More Science Worksheets
Year 8
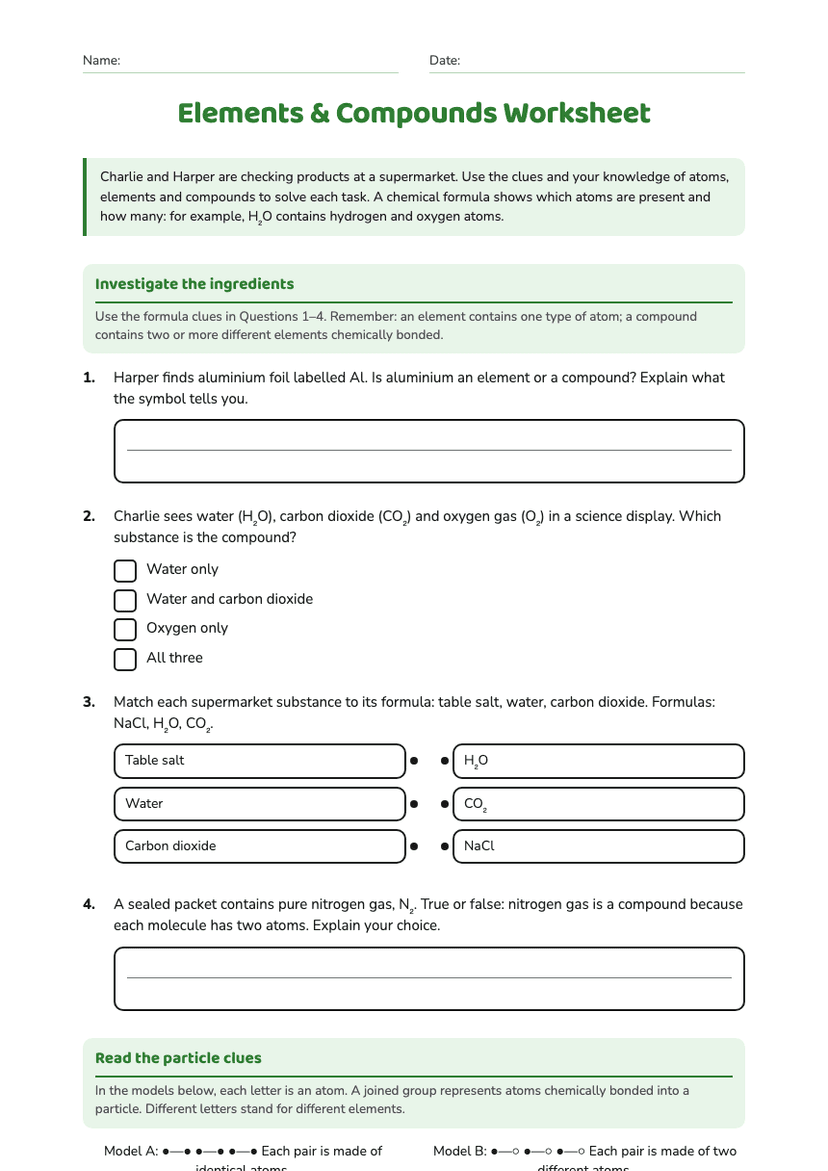
Elements & Compounds Worksheet
Free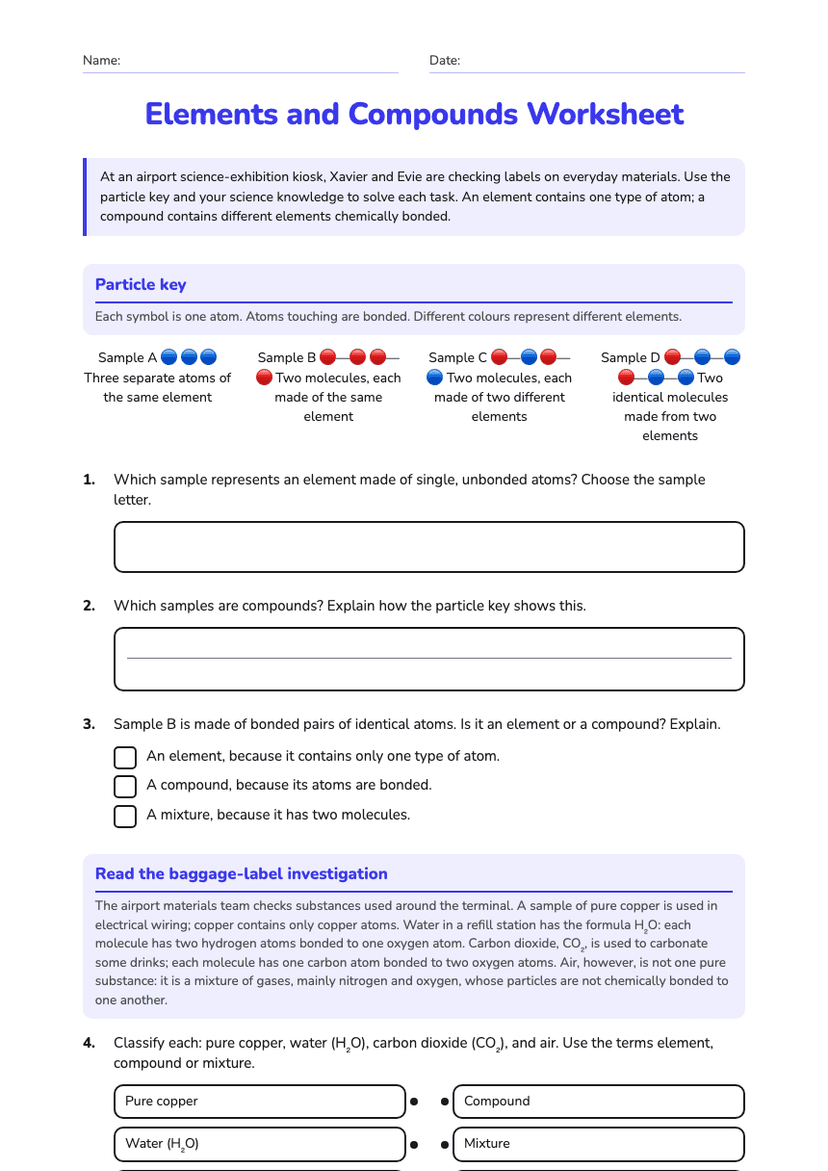
Year 8
Elements and Compounds Worksheet
Free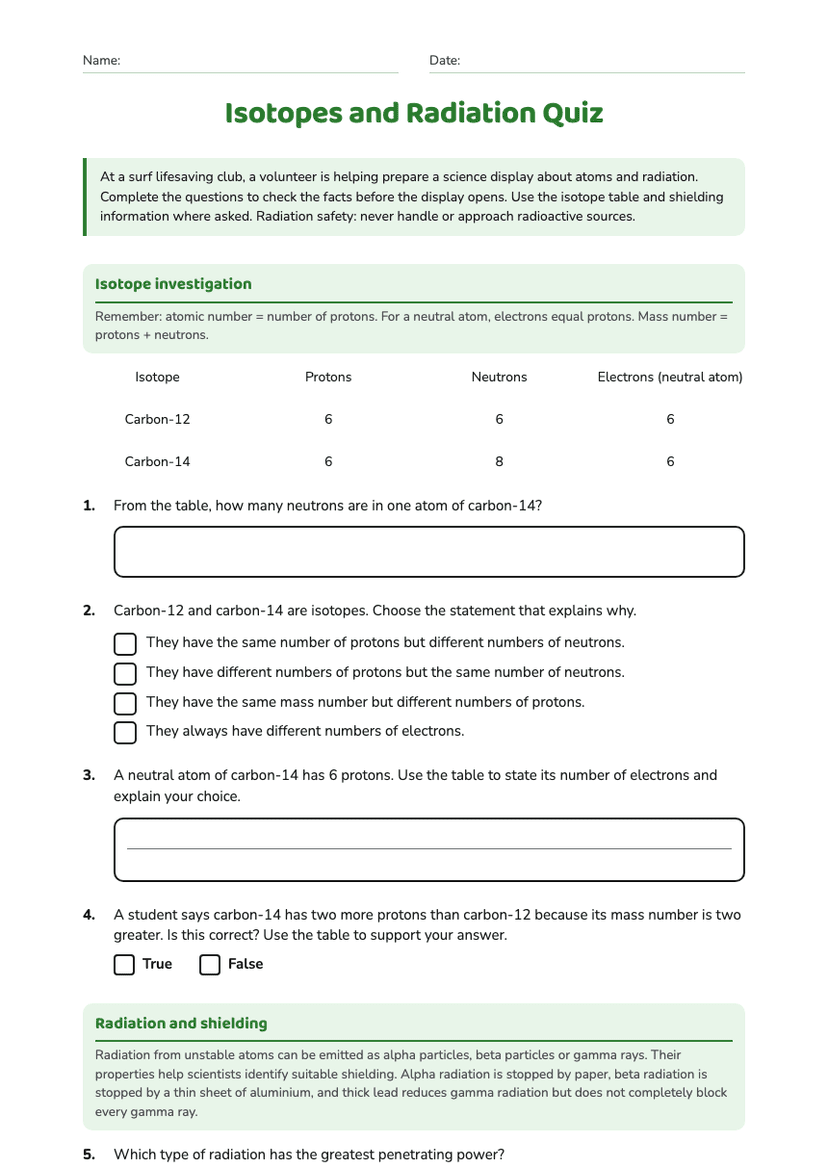
Isotopes and Radiation Quiz
Free
Year 8
Chemical Symbols and Formulas
Free
Year 7
Exploring Solutions Worksheet
Free
Year 9
Reproducible Chemical Testing Worksheet
Free
Year 10
Conservation of Mass
Free
Year 11