Year 7 Statistics and Probability Pretest
A free maths worksheet ready for your classroom. Open in Kuraplan to grab the print-ready PDF, customize it for your students, or generate a fresh version in seconds.
Year 7 Statistics and Probability Pretest
Part 1: Data and Displays
Instructions: Answer all questions. Show working where needed. You may use a calculator only if your teacher allows it.
a) Favourite colour: ____________________
b) Number of siblings: ____________________
c) Height in centimetres: ____________________
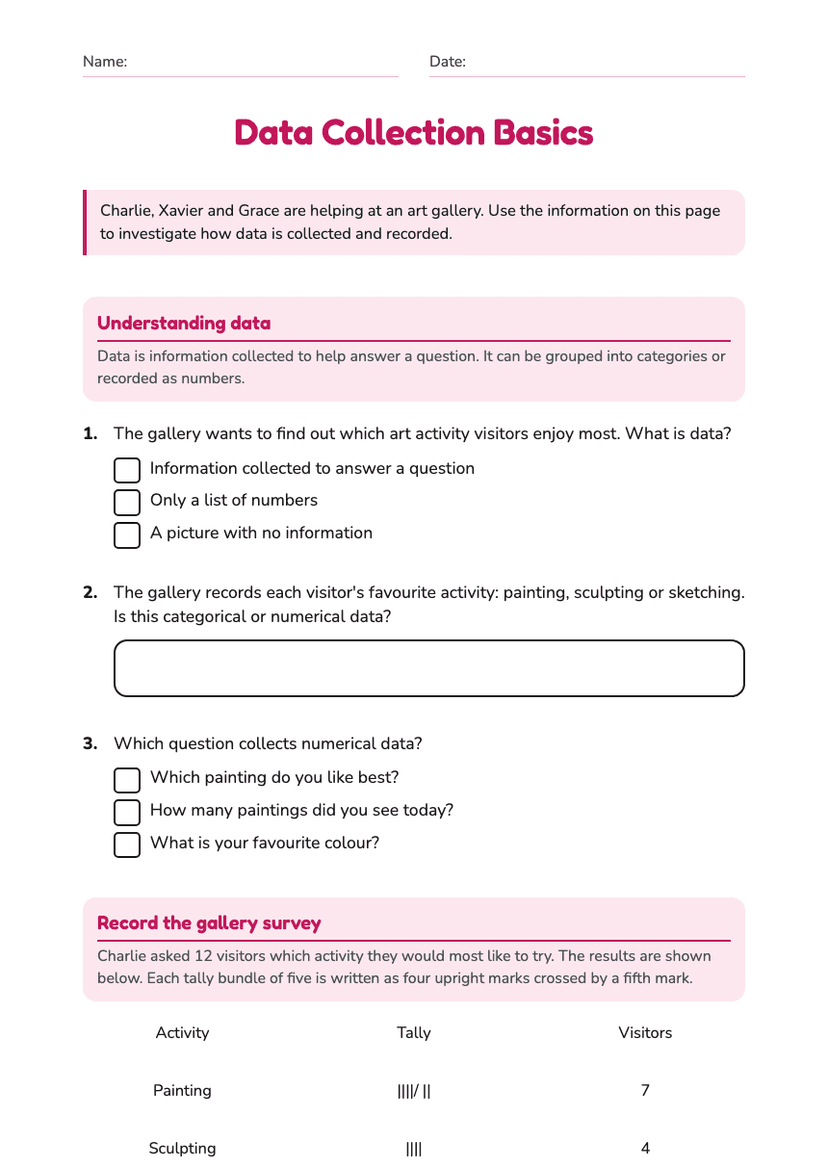
Football: 8 students Netball: 6 students Basketball: 10 students Tennis: 4 students
a) Which sport was most popular? ____________________
b) How many students were surveyed altogether? ____________________
c) How many more students chose basketball than tennis? ____________________
2, 5, 3, 5, 7, 4, 2
Calculate the:
a) mean: ____________________
b) median: ____________________
c) mode: ____________________
d) range: ____________________
Part 2: Investigations and Probability
18, 21, 19, 21, 23, 20, 21
a) Create a dot plot or a stem-and-leaf plot to display the data.
b) What temperature occurred most often? ____________________
Group A: 10, 15, 15, 20, 20, 20, 25
Group B: 5, 10, 15, 20, 25, 30, 35
a) Find the median for each group.
Group A: __________ Group B: __________
b) Which group has the greater range? Explain how you know.
• the question to investigate
• who should be surveyed and how a fair sample could be chosen
• how the results could be displayed
a) List the sample space.
____________________________________________
b) What is the probability of choosing a blue counter?
____________________
a) What is the probability of rolling an even number?
____________________
b) What is the probability of rolling a number greater than 4?
____________________
Teacher Answer Key and Diagnostic Mapping
Answers
1. a) Categorical. b) Discrete numerical. c) Continuous numerical.
2. a) Basketball. b) 28 students. c) 6 students.
3. Ordered data: 2, 2, 3, 4, 5, 5, 7. Sum = 28. Mean = 28 ÷ 7 = 4. Median = 4. Mode = 2 and 5. Range = 7 − 2 = 5.
4. No. The mode is the value that occurs most often. The mean is found by adding all values and dividing by the number of values. For this data, the mean is 4 and the modes are 2 and 5.
5. A correct display has 18 once, 19 once, 20 once, 21 three times and 23 once. The most common temperature is 21°C. A correct stem-and-leaf plot may be:
1 | 8 9
2 | 0 1 1 1 3
Key: 2 | 1 means 21°C.
6. Group A median = 20 minutes. Group B median = 20 minutes. Group A range = 25 − 10 = 15 minutes. Group B range = 35 − 5 = 30 minutes. Group B has the greater range because its data are more spread out.
7. Answers will vary. A strong response includes a clear question, a fair sample such as randomly selecting students from each Year 7 class, and a suitable display such as a column graph or percentage graph. The response should explain how results will be compared.
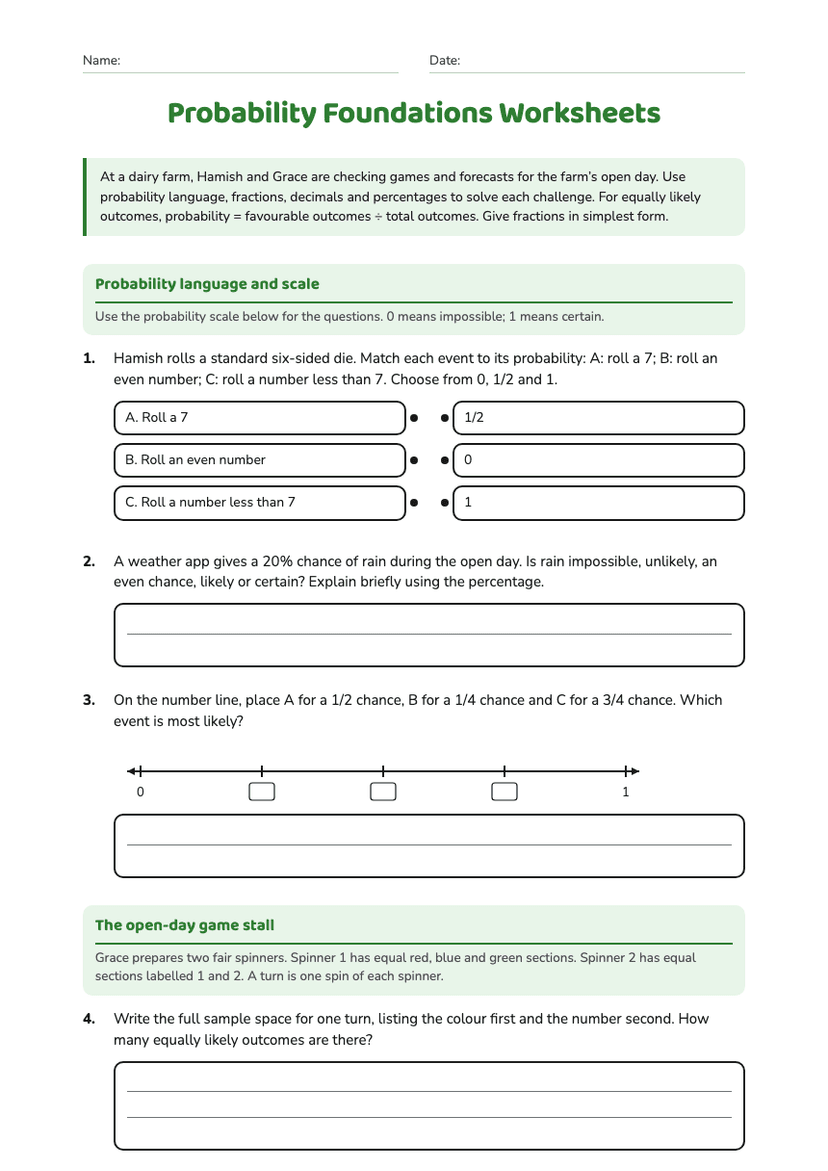
8. a) {red, blue, green}. b) 1 out of 3, or 1/3.
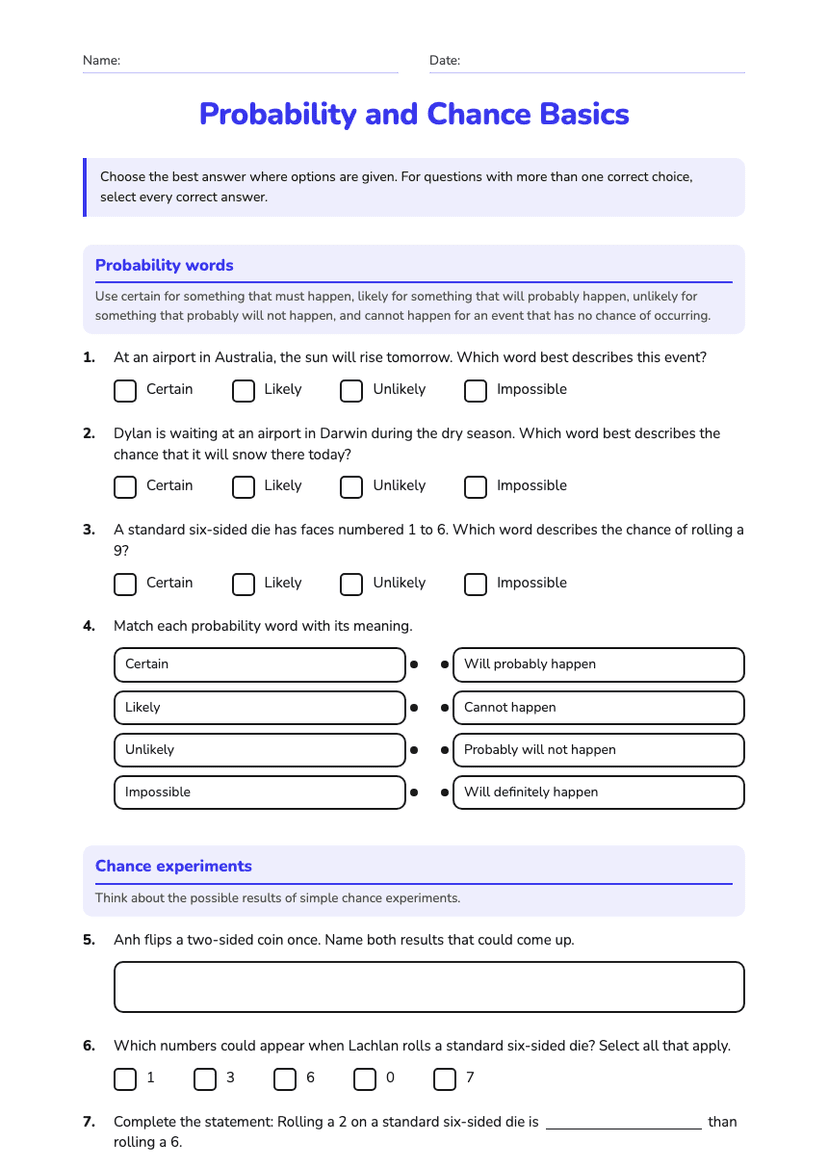
9. a) Even outcomes are 2, 4 and 6, so the probability is 3/6 = 1/2. b) Outcomes greater than 4 are 5 and 6, so the probability is 2/6 = 1/3.
Diagnostic Mapping
VC2M7ST01: Questions 1 and 7 — identify categorical and numerical variables; plan how data can be collected.
VC2M7ST02: Questions 2, 5 and 6 — represent, read and interpret data using graphs, dot plots and stem-and-leaf plots.
VC2M7ST03: Questions 3, 4 and 6 — calculate and interpret mean, median, mode, range and the spread of distributions.
VC2M7P01: Questions 8 and 9 — list sample spaces and assign probabilities to equally likely outcomes.
VC2M7P02: Questions 8 and 9 — interpret probability as a measure from 0 to 1 and connect probability with possible outcomes.
About This Worksheet
Free in Kuraplan
Sign up free, grab the PDF, and customize it for your class.
Print-Ready
Formatted for standard paper. Clean layout, easy to read.
AI-Generated
Created with Kuraplan's AI, designed for real classroom use.
For Teachers & Parents
Use in classrooms, for homework, tutoring, or homeschool.
Need a custom version of this worksheet?
Kuraplan's AI generates custom worksheets in seconds — differentiated for every learner, aligned to your curriculum.
Generate Custom Worksheets — Free