
Demand Curves and Flow-On Effects
Year 11 Economics Understanding market dynamics and interconnected effects
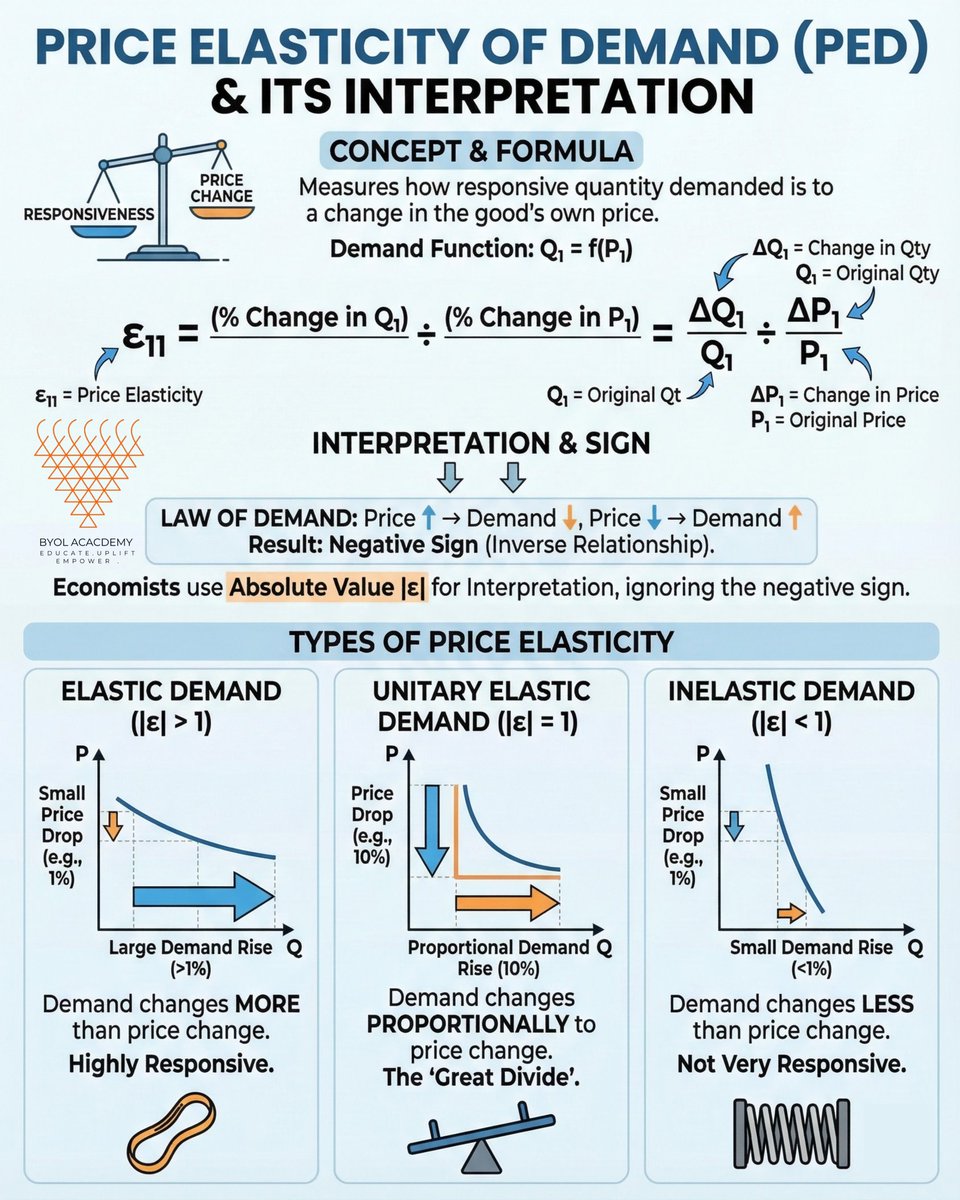
Quick Recap: The Law of Demand
As price increases, quantity demanded decreases As price decreases, quantity demanded increases Assumes all other factors remain constant (ceteris paribus) Represented by a downward-sloping demand curve

Activity: Demand Curve Practice
Draw a demand curve for movie tickets Price range: $5-$25 Show what happens when ticket prices drop from $20 to $10 Predict the change in quantity demanded

What Are Flow-On Effects?
Changes in one market affect other related markets Also called 'spillover effects' or 'ripple effects' Can be positive or negative impacts Show how interconnected the economy really is

Types of Flow-On Effects
{"left":"Substitute goods: increase in demand for one decreases demand for another\nComplementary goods: increase in demand for one increases demand for another","right":"Derived demand: demand for resources used to make the product\nIncome effects: changes affect consumers' purchasing power"}

Think-Pair-Share
If the price of smartphones decreases significantly, what flow-on effects might we see? Consider: phone cases, mobile plans, landline phones, tablet computers Discuss with a partner for 3 minutes
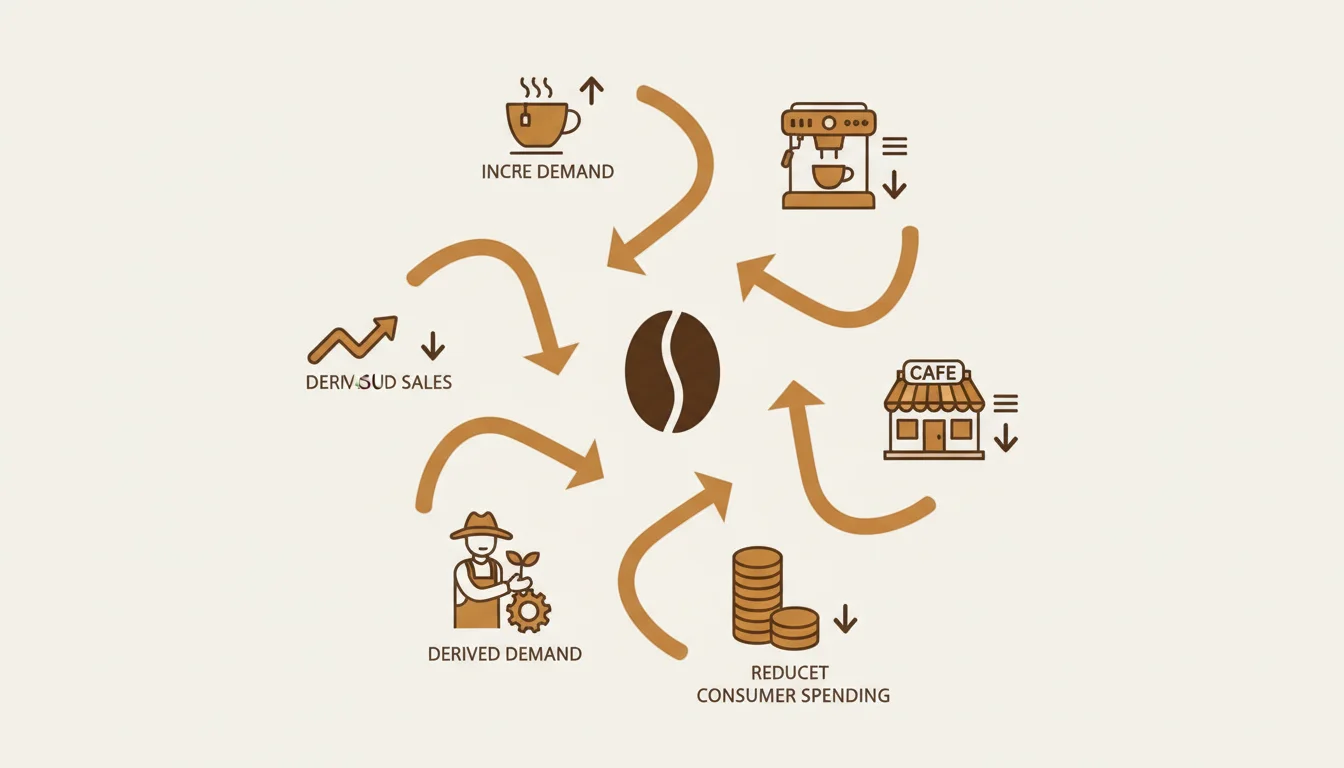
Coffee Market Flow-On Effects

Case Study Analysis
Scenario: Petrol prices increase by 50% Work in groups of 3-4 Identify at least 5 flow-on effects Classify each as substitute, complement, or derived demand Present your findings to the class

Real-World Example: COVID-19 Impact
Increased demand for home exercise equipment Decreased demand for gym memberships Increased demand for streaming services Decreased demand for cinema tickets Flow-on effects in delivery services and technology

Key Takeaway
"In economics, everything is connected. A change in one market sends waves throughout the entire economy, affecting prices, employment, and consumer choices in ways we might not immediately expect."