
Exploring Data: Tables and Tree Diagrams
Year 9 Mathematics Understanding data organisation and probability

Learning Objectives
Understand how to read and create data tables Construct and interpret two-way tables Draw and analyse tree diagrams for probability Apply these tools to solve real-world problems
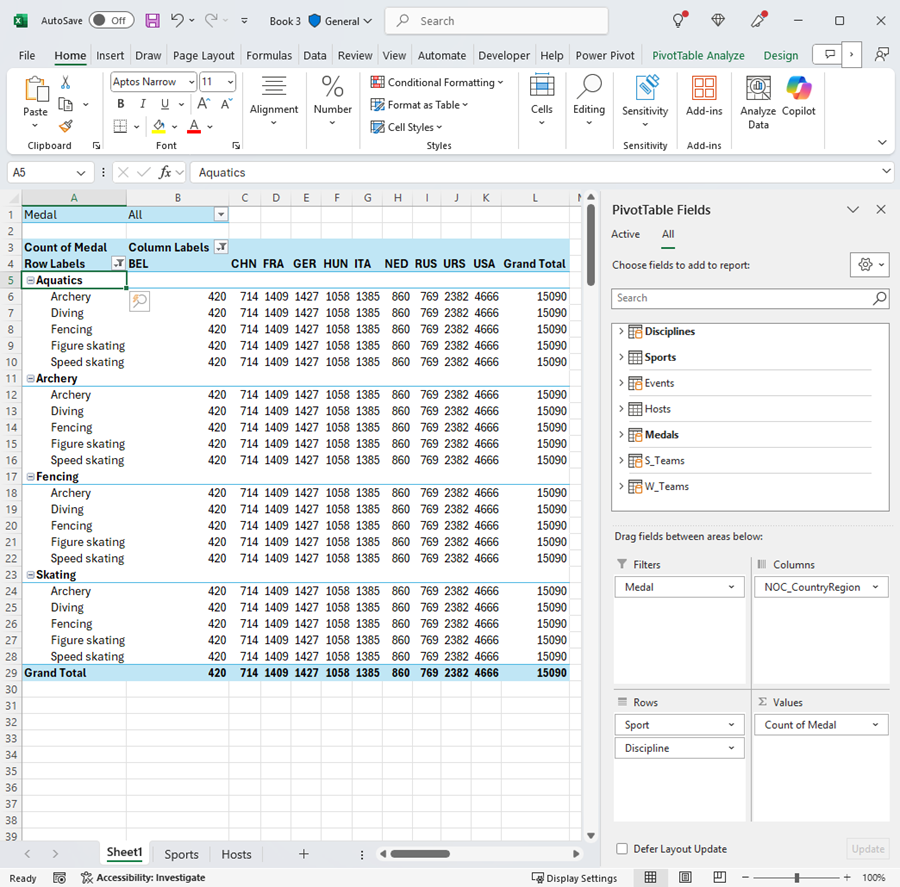
What is a Data Table?
Organised way to display information in rows and columns Rows represent individual records or observations Columns represent different variables or categories Makes data easy to read and compare

Activity: Creating Our Class Data Table
Work in pairs to collect data from 5 classmates Record: Name, Favourite Subject, Hours of Sleep, Favourite Colour Organise your data into a clear table format Be ready to share one interesting observation

Introduction to Two-Way Tables
Shows relationship between TWO variables Also called contingency tables or cross-tabulations Rows show categories of one variable Columns show categories of another variable Cells show frequencies or counts

Two-Way Table Example: Sports Preferences
{"left":"Boys: Football 15, Basketball 8, Tennis 3\nGirls: Football 6, Basketball 12, Tennis 9\nTotal Football: 21 students","right":"Total Basketball: 20 students\nTotal Tennis: 12 students\nThis shows clear patterns in preferences"}
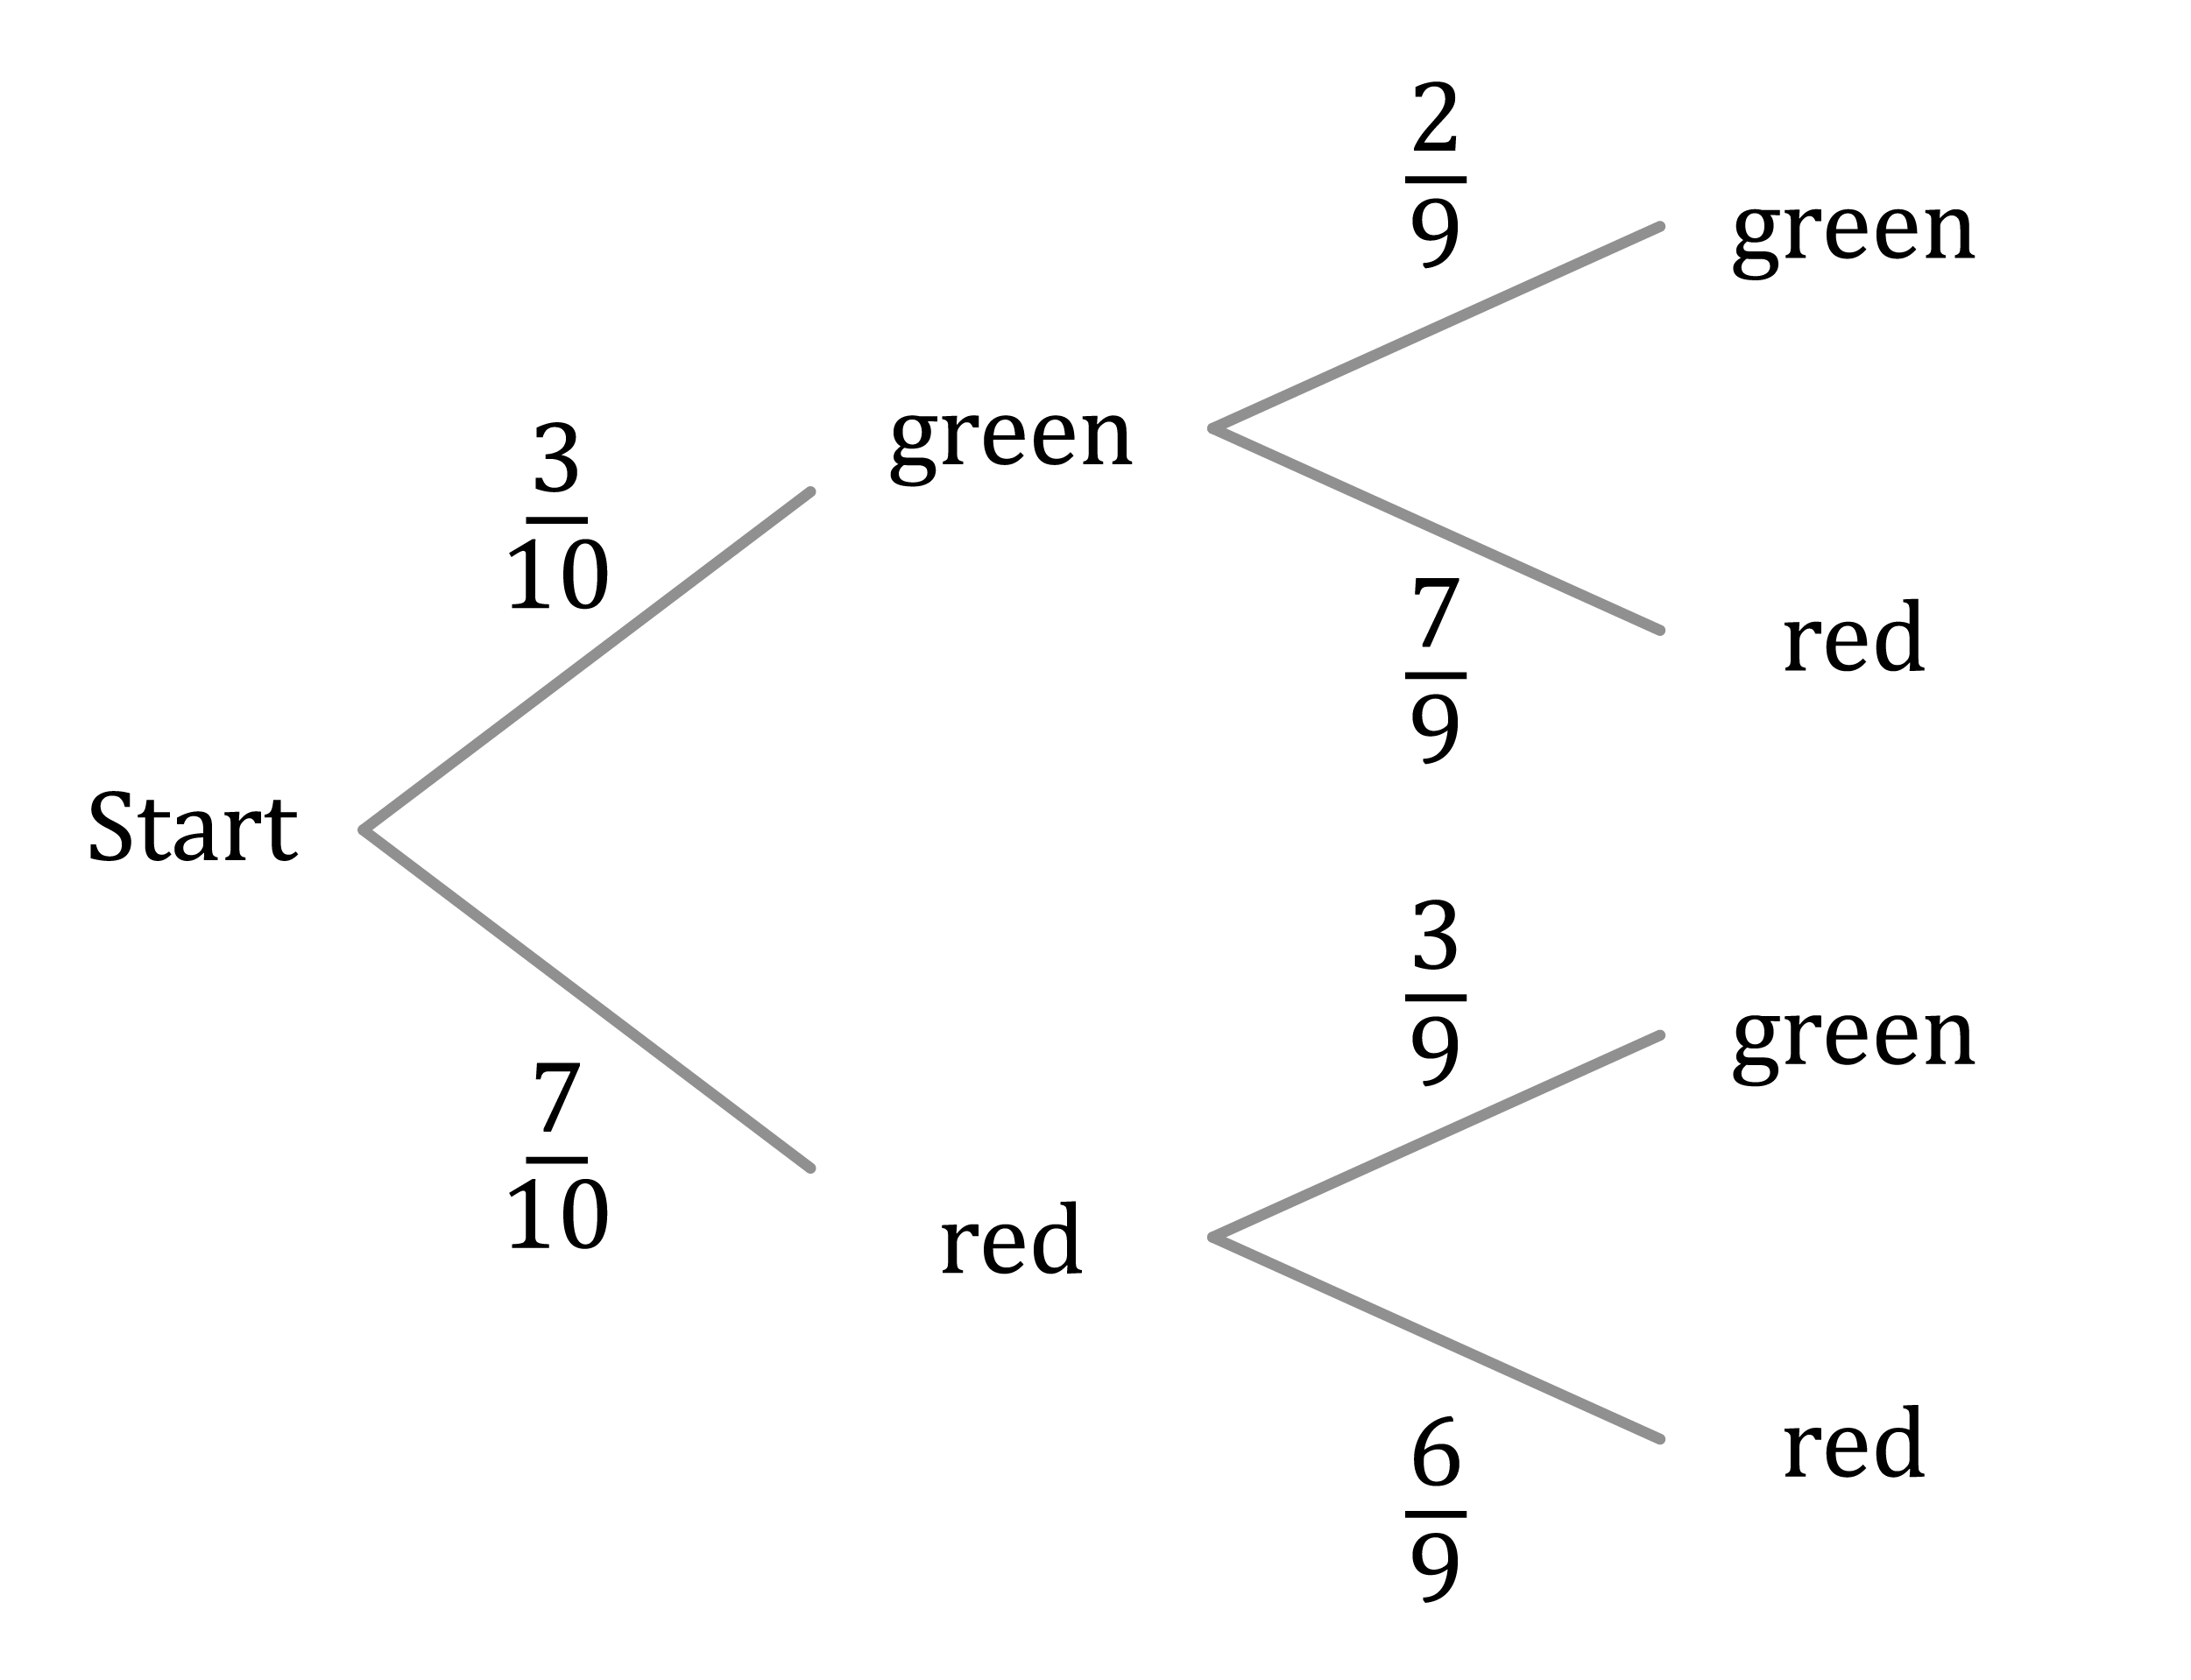
What are Tree Diagrams?
Visual way to show all possible outcomes Branches represent different possibilities Useful for calculating probabilities Each path shows a sequence of events Probabilities multiply along each path
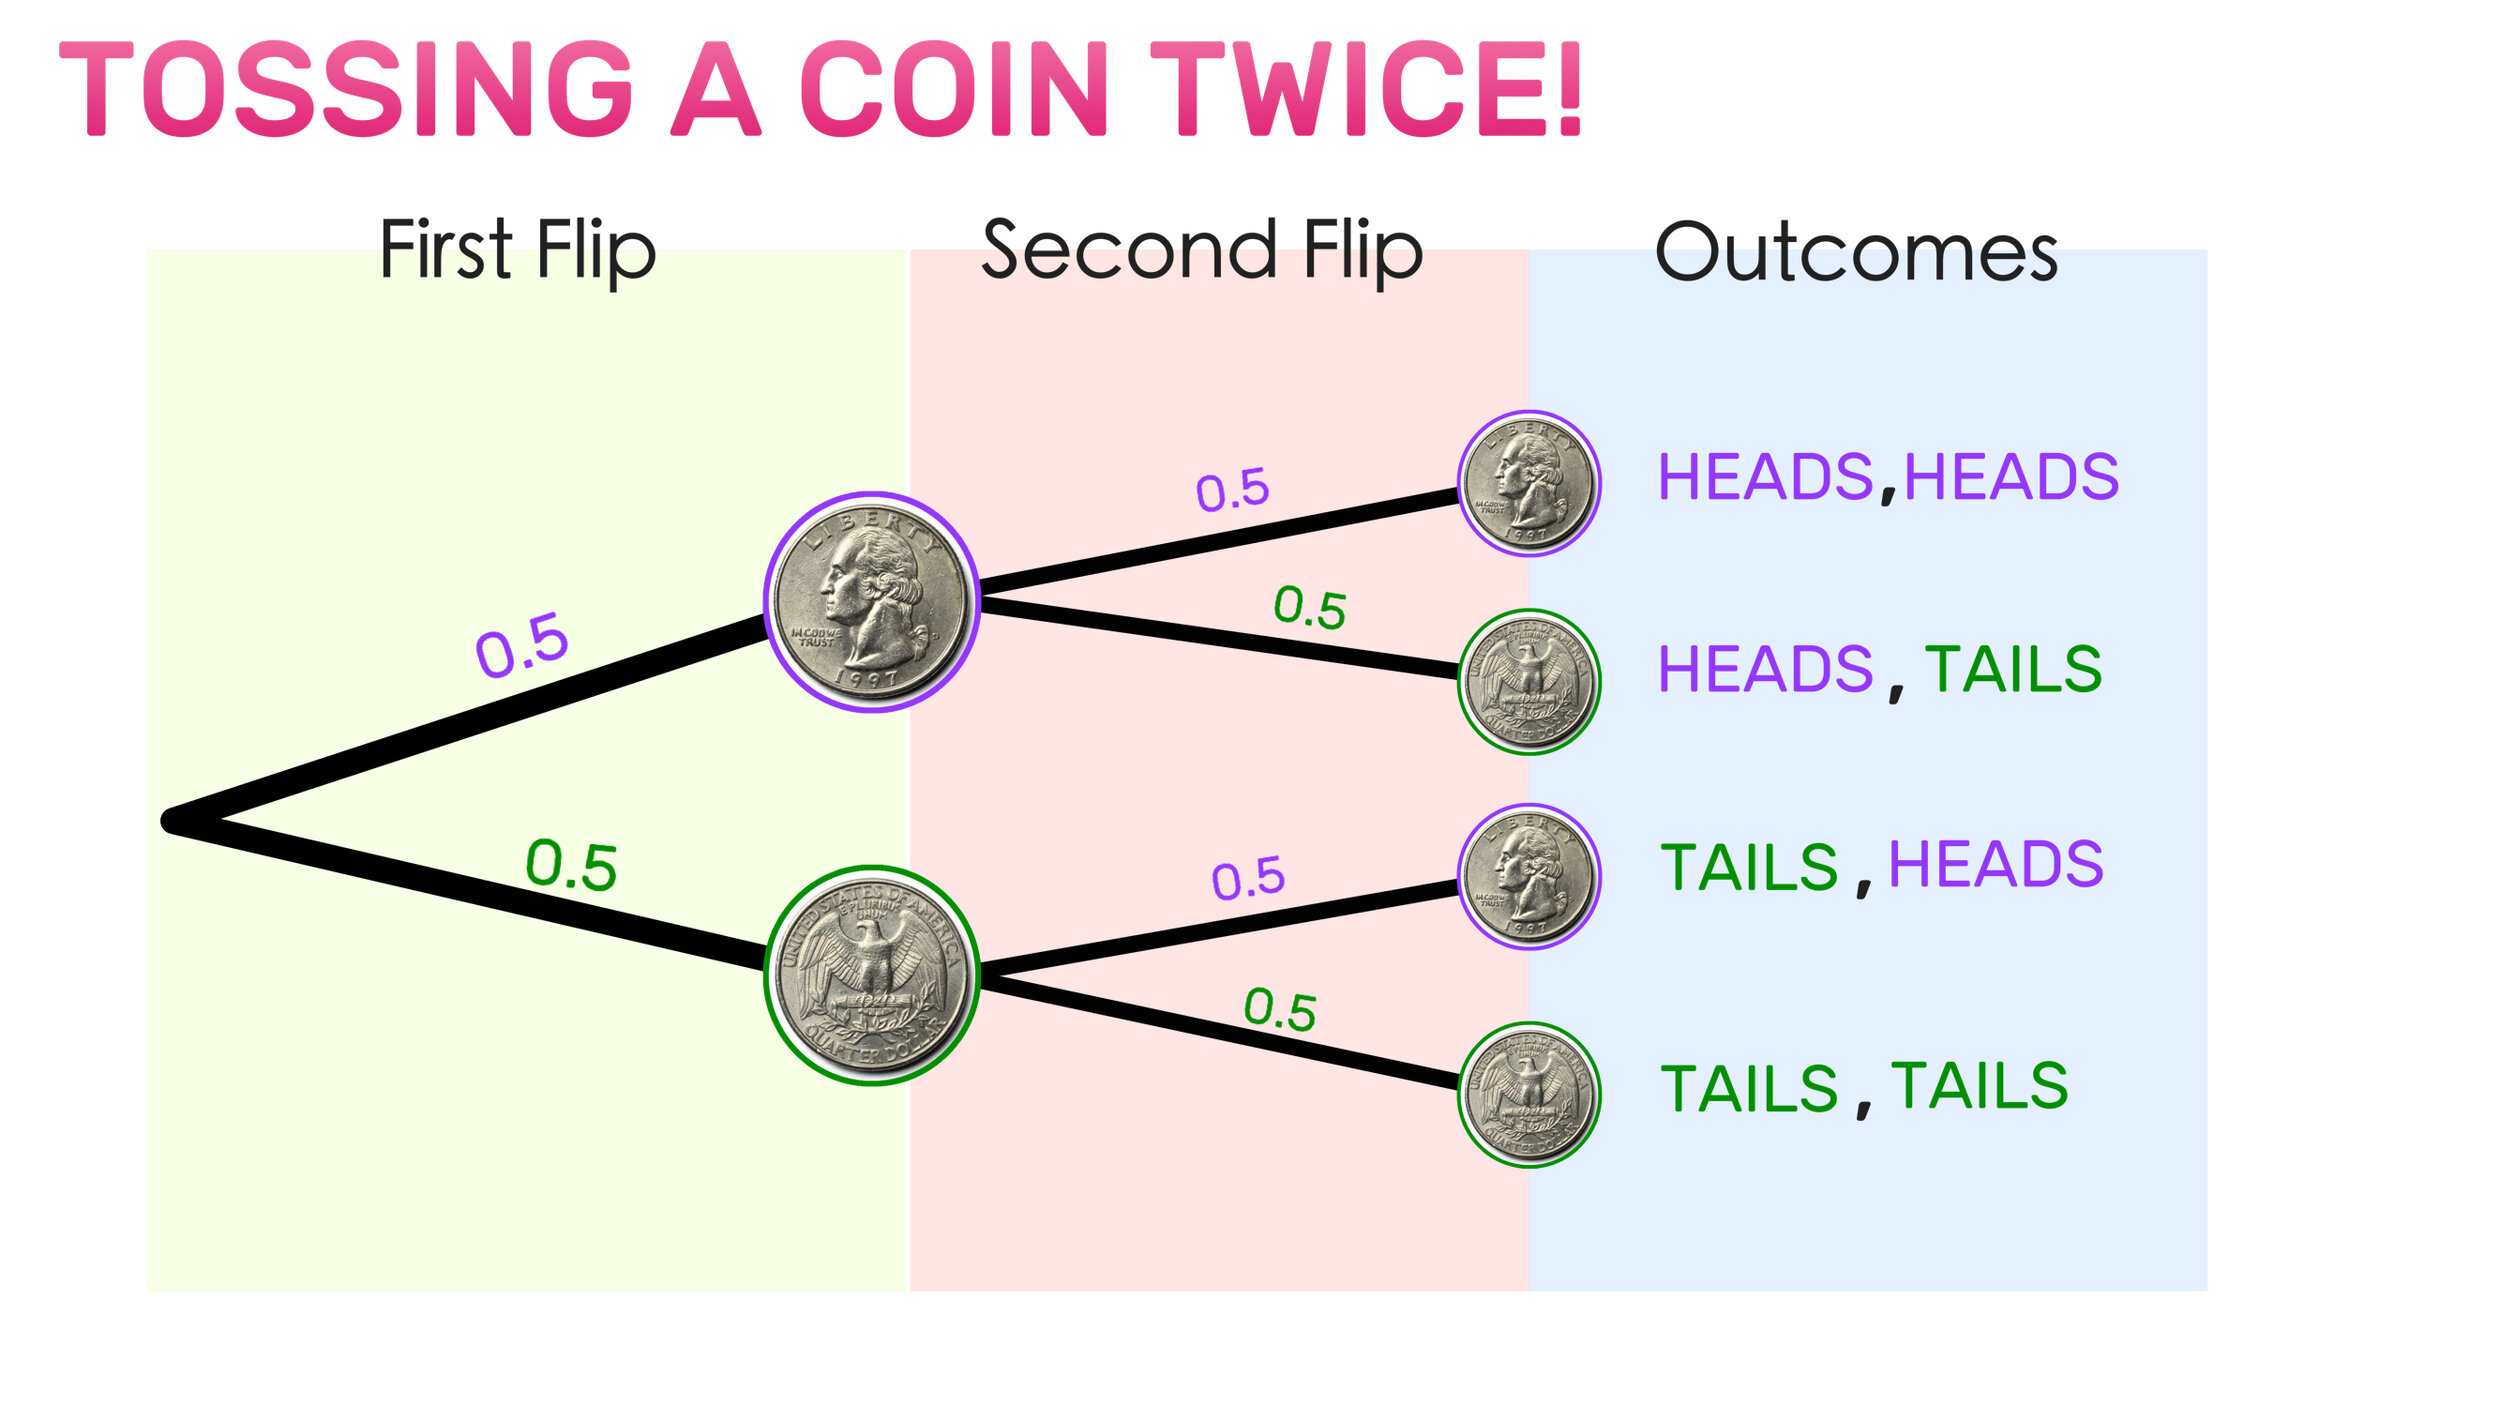
Tree Diagram: Coin Flip Example

Practice: Create Your Own Tree Diagram
Scenario: Drawing two cards from a deck (with replacement) First card: Red or Black Second card: Red or Black Draw the complete tree diagram Calculate probability of getting two red cards
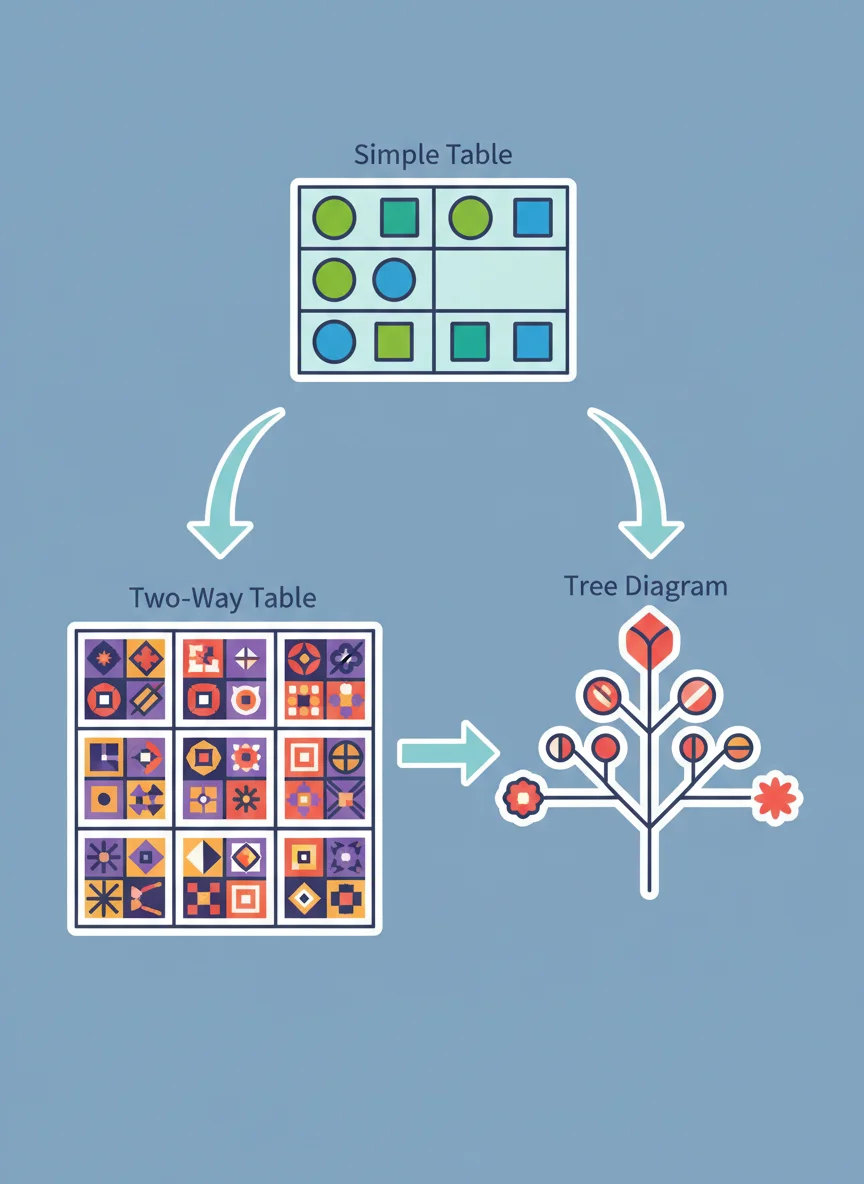
Summary and Next Steps
Tables organise data in rows and columns Two-way tables show relationships between variables Tree diagrams map out probability scenarios All three tools help us understand data better Practice using these in different contexts