
Investigating Bivariate Data Relationships
NCEA Level 3 AS91581 Mathematics Year 13 Understanding relationships between two variables

Learning Objectives
Understand what bivariate data means Identify different types of relationships Create and interpret scatter plots Calculate correlation coefficients Perform regression analysis Make predictions using mathematical models

What is Bivariate Data?
Think about height and weight Temperature and ice cream sales Study time and test scores What do these pairs have in common?

Definition: Bivariate Data
Data involving TWO variables measured on the same subjects Each observation has a pair of values (x, y) We investigate if there's a relationship between the variables Examples: (height, weight), (age, income), (hours studied, exam score)
Types of Variables
{"left":"Quantitative variables\nCan be measured numerically\nHeight, weight, temperature, time\nAllow for mathematical operations","right":"Qualitative variables\nCategories or labels\nGender, color, brand preference\nCannot perform arithmetic operations"}

Data Collection Activity
Collect height and arm span data from class Measure each student's height in cm Measure arm span fingertip to fingertip Record as ordered pairs (height, arm span) We'll use this data throughout the unit
Scatter Plots: Visualizing Relationships
Graph with two quantitative variables Each point represents one observation x-axis: explanatory variable (independent) y-axis: response variable (dependent) Pattern of points reveals the relationship

Creating Your First Scatter Plot
Plot the Class Data
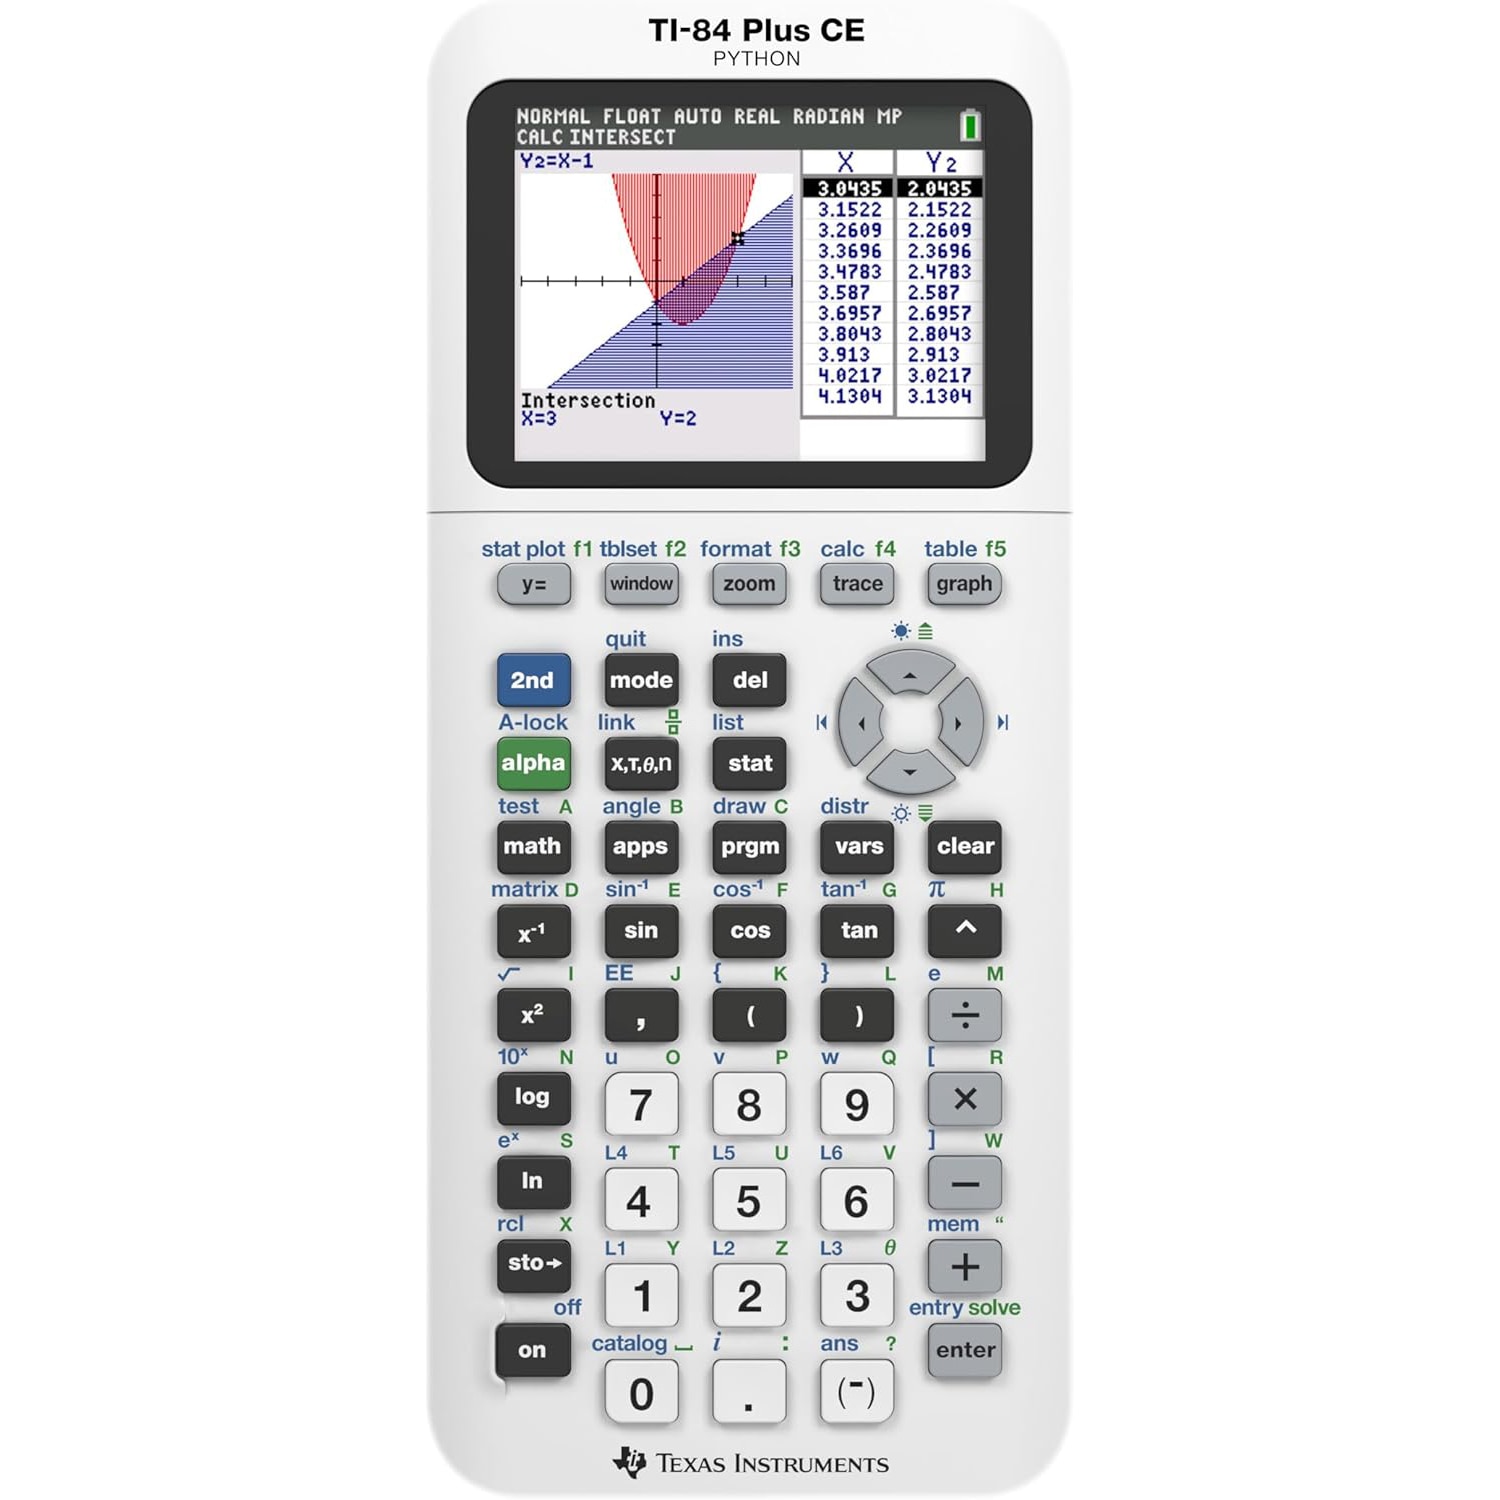
Use graph paper or graphing calculator Height on x-axis, arm span on y-axis Plot each student's data point What pattern do you observe? Discuss findings with a partner

Types of Relationships
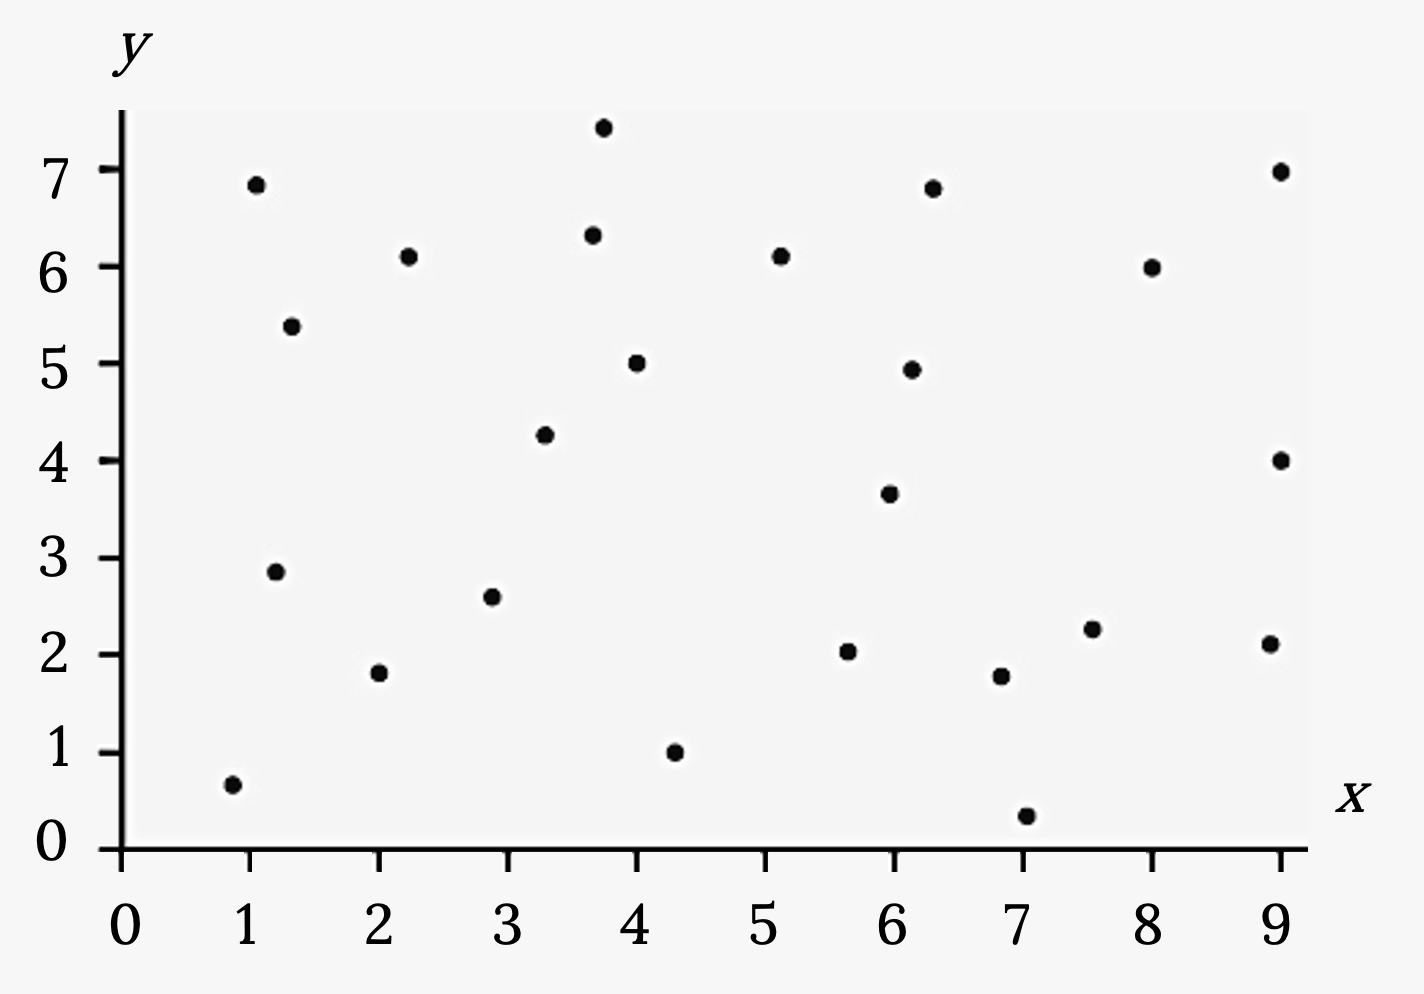
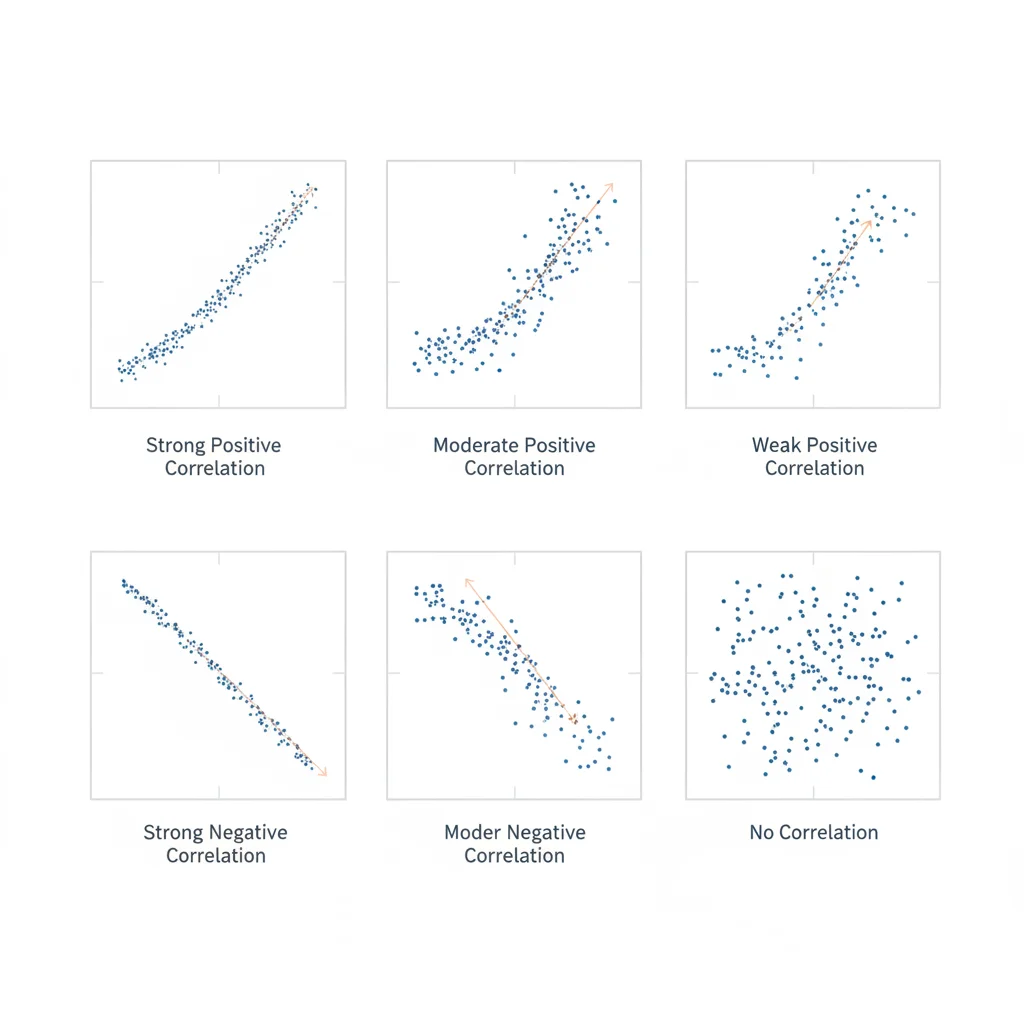
Positive relationship: as x increases, y increases Negative relationship: as x increases, y decreases No relationship: no clear pattern Strength varies from weak to strong
Relationship Strength
How do we determine if a relationship is strong or weak? What makes points 'close to a line'? Can you think of examples of very strong relationships? What about very weak relationships?

Correlation Coefficient (r)
Numerical measure of linear relationship strength Always between -1 and +1 r = +1: perfect positive relationship r = -1: perfect negative relationship r = 0: no linear relationship
18 more slides available after you open the deck.
Download all 30 slides