Mastering Exposure with Camera Histograms
Understanding Light Distribution Improving Your Photography Skills Year 9 Photography
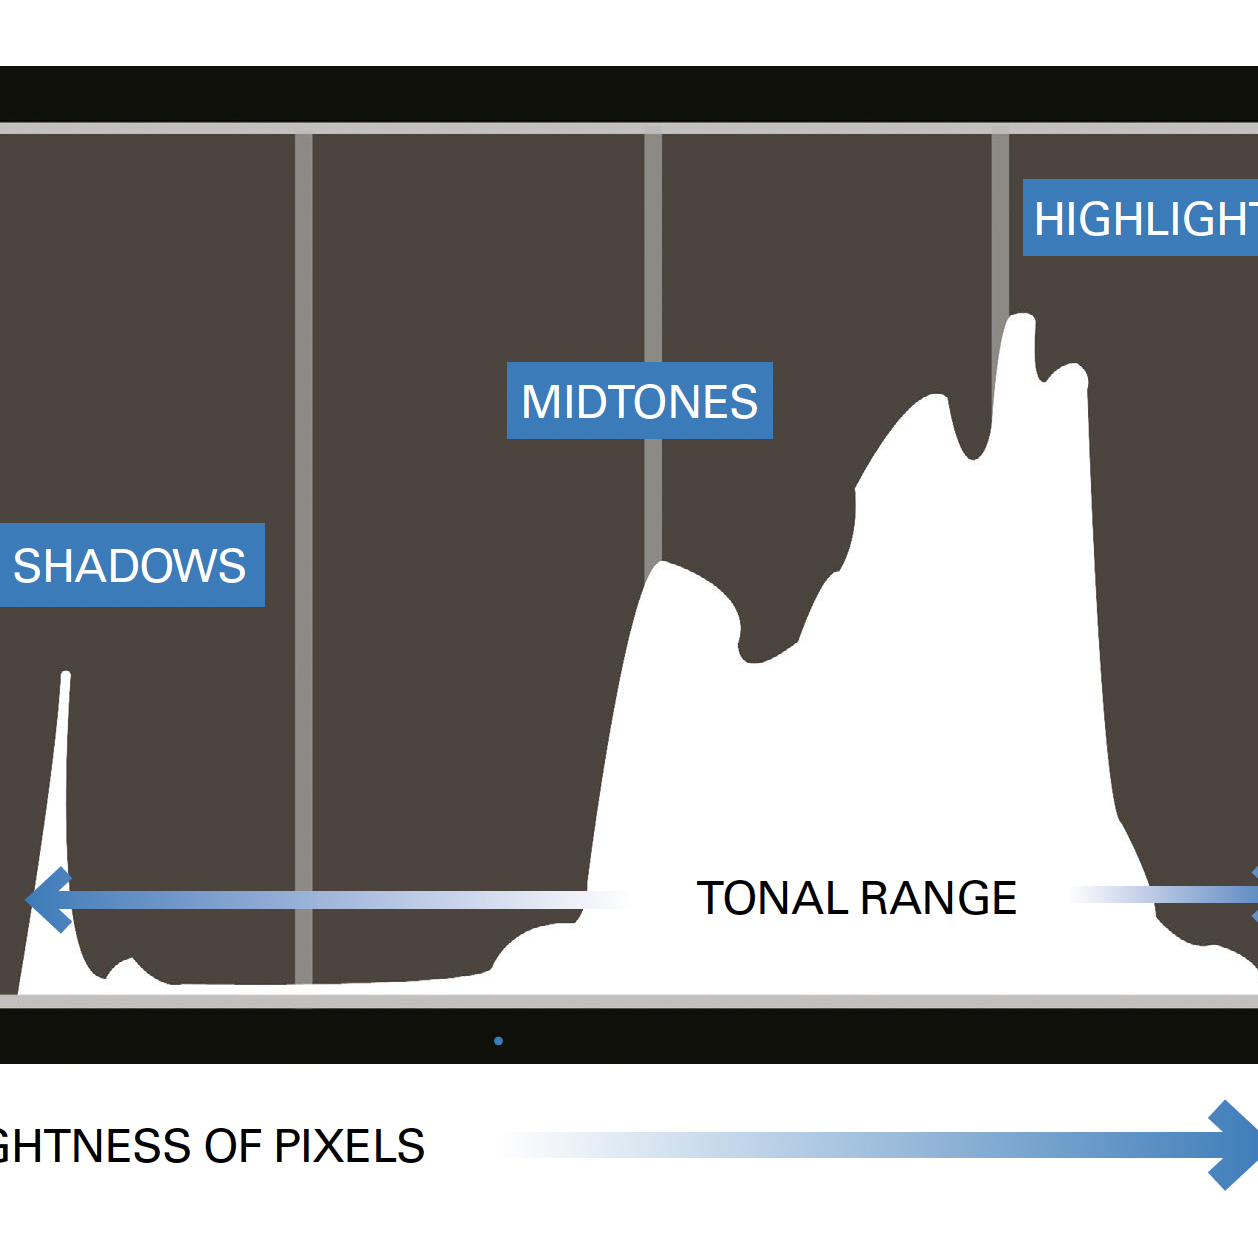
What is a Histogram?
A graph showing light distribution in your image Shows brightness levels from 0% (black) to 100% (white) Displays how many pixels exist at each brightness level Available on most digital cameras and editing software
Reading the Histogram Scale
Left side (0%) = Pure black shadows Middle = Mid-tones (grays) Right side (100%) = Pure white highlights Height of peaks = Number of pixels at that brightness
Histogram Shapes and What They Mean
{"left":"Well-exposed image: Bell curve in center\nUnderexposed: Data pushed to left side\nOverexposed: Data pushed to right side","right":"High contrast: Peaks at both ends\nLow contrast: Narrow peak in middle\nClipping: Data cut off at edges"}

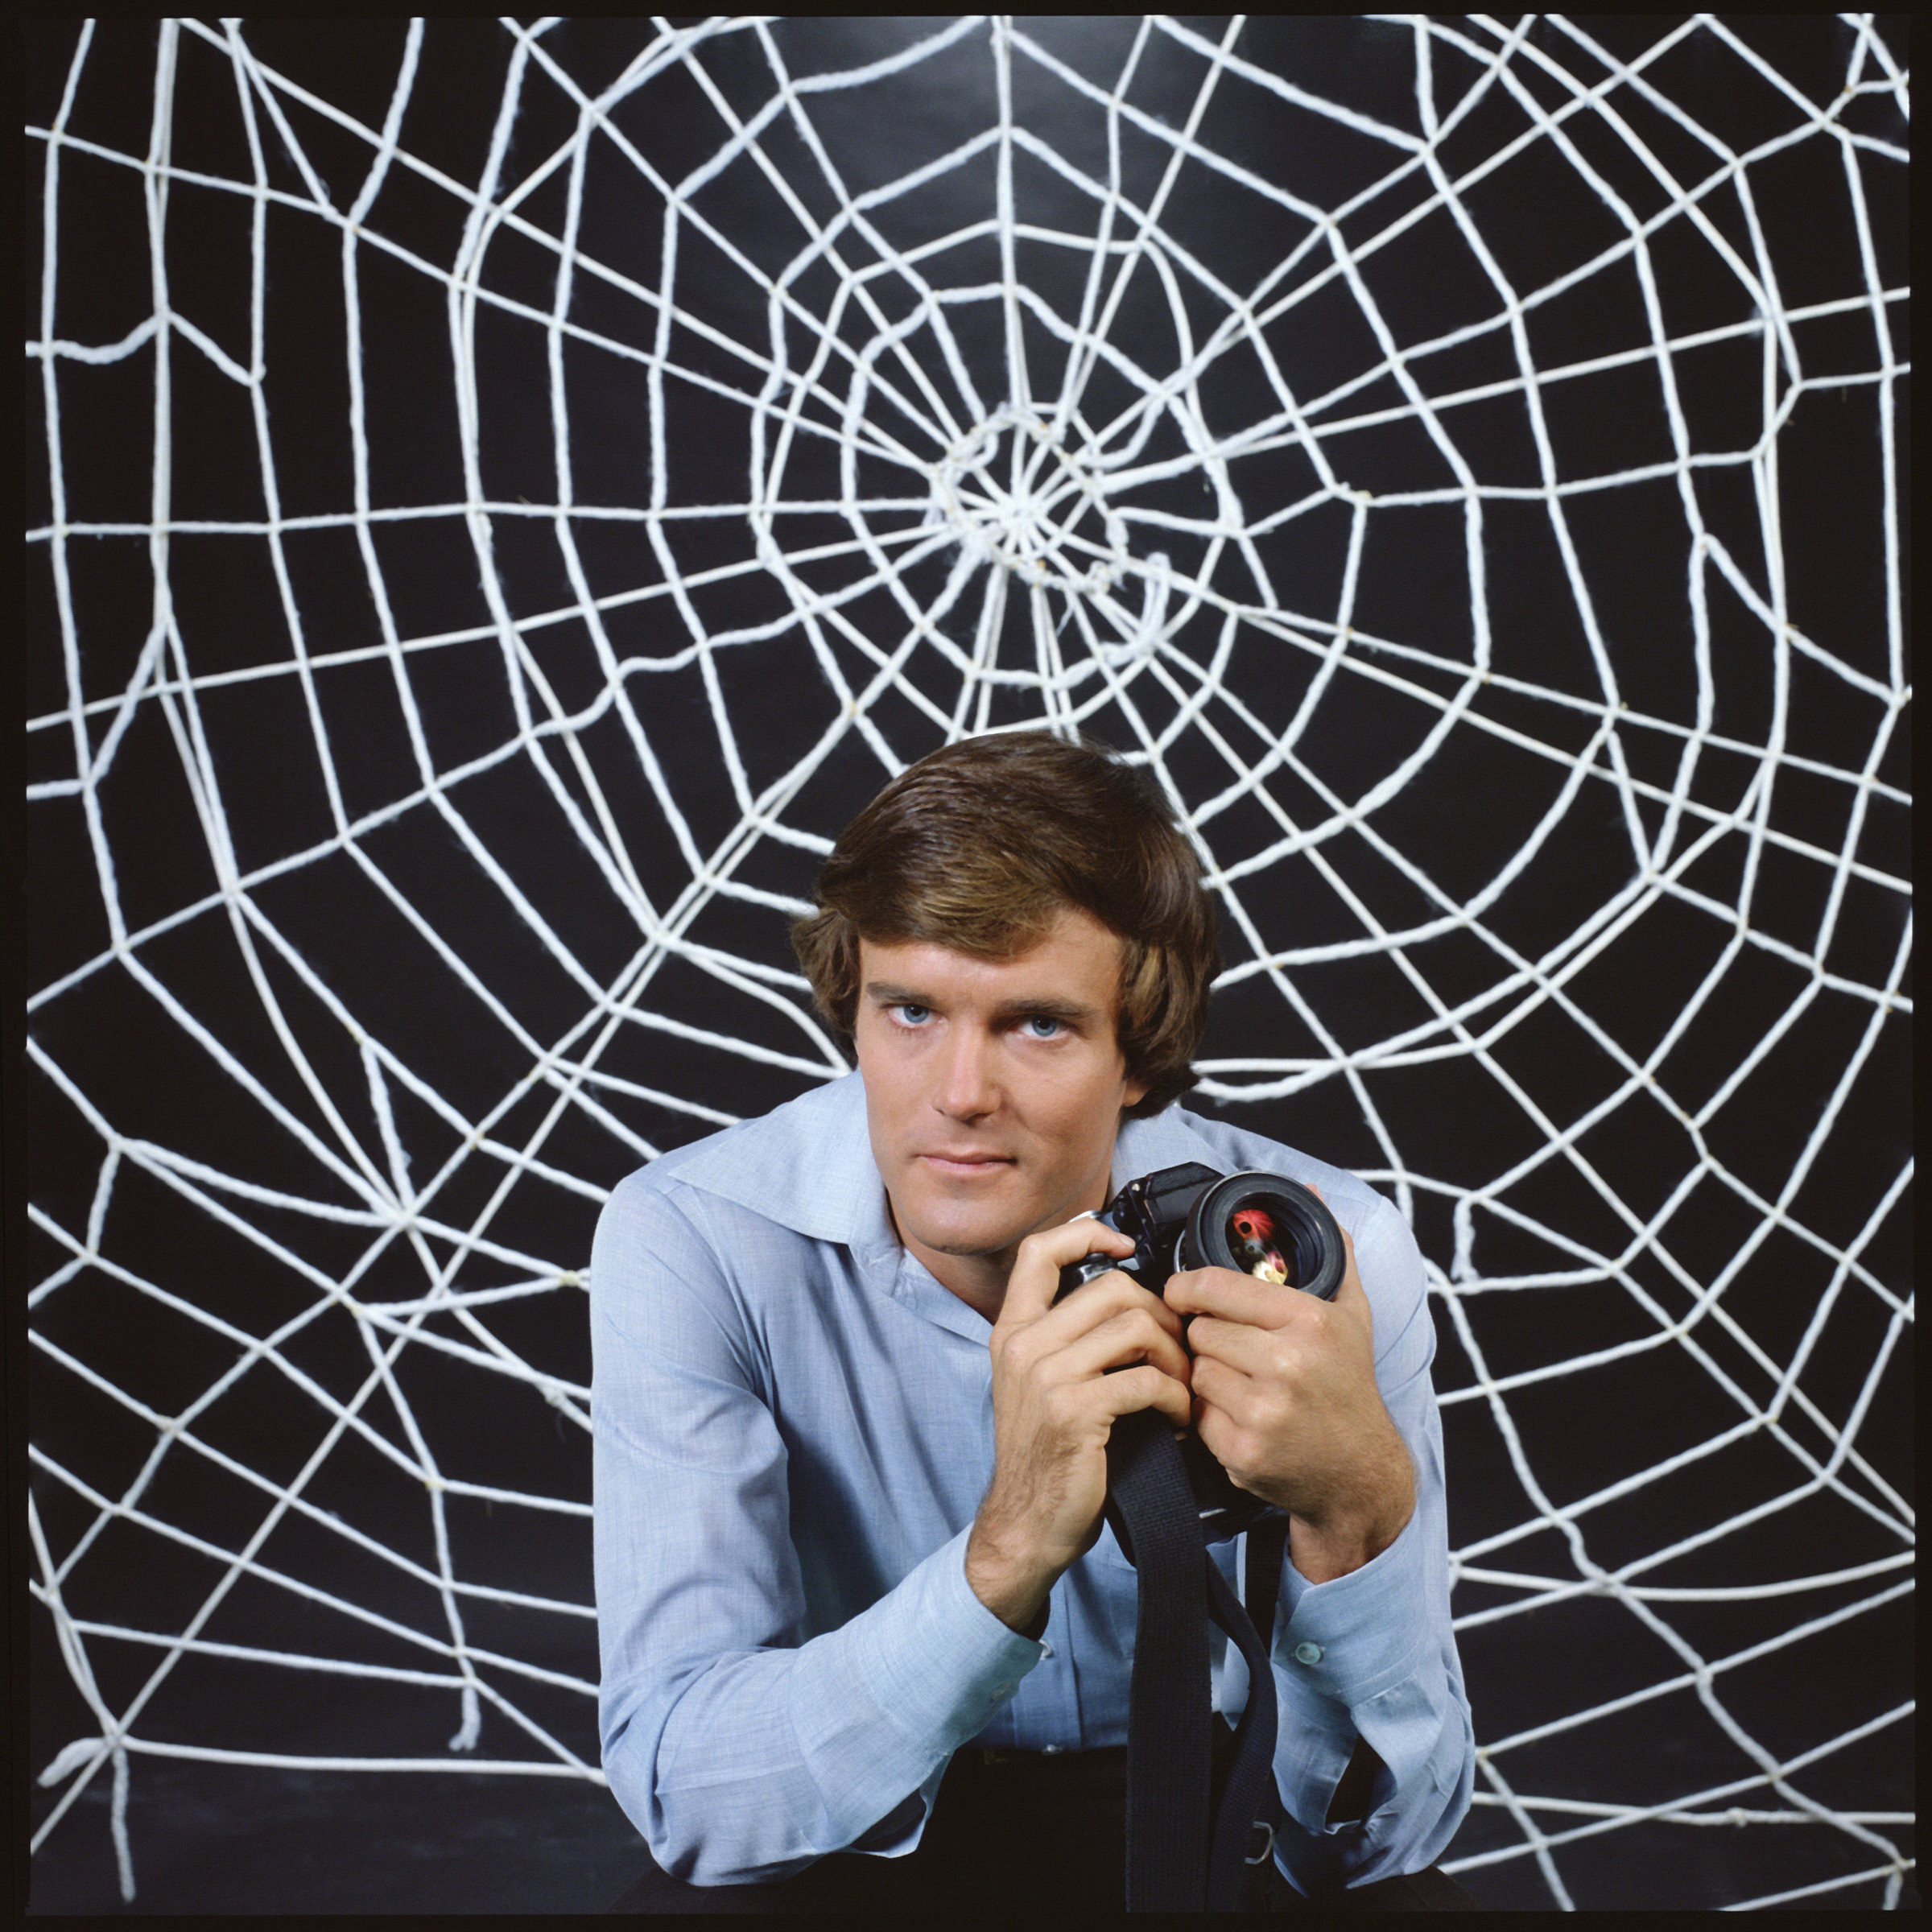
Histogram Analysis Challenge
Look at the sample photos provided Identify if each image is underexposed, overexposed, or well-exposed Predict what the histogram would look like Check your predictions against the actual histograms

Exposing to the Right (ETTR)
Advanced technique for better image quality Capture more light data without overexposing Push histogram toward highlights but avoid clipping Provides more flexibility in post-processing
Quick Check: Histogram Reading
If you see a histogram with all the data pushed to the left side, what does this tell you about your photo? What should you adjust on your camera to fix this?
:max_bytes(150000):strip_icc()/three-friends-sitting-on-mountain-top-559287563-5c53c9a7c9e77c0001a404c9.jpg)
Common Histogram Mistakes to Avoid
Clipping highlights (losing white detail) Clipping shadows (losing black detail) Ignoring the histogram completely Assuming all histograms should look the same
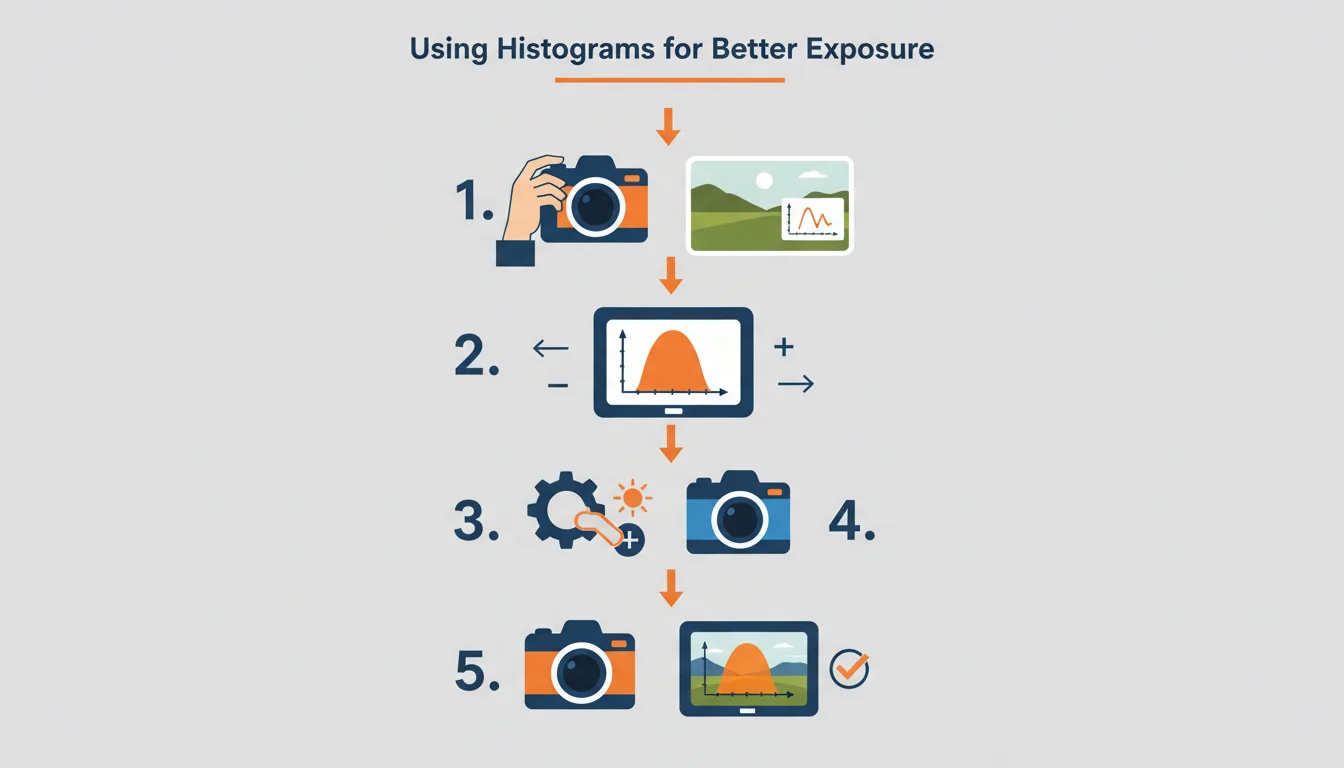
Histogram Workflow for Better Photos
Practice and Next Steps
Use your camera's histogram display for every shot Practice identifying exposure problems before they happen Experiment with different lighting conditions Remember: histograms are tools, not rules