Statistics for Social Change: Data Foundations
Year 8 Mathematics Understanding data to make a difference Lesson 1 of 20

How Do Statistics Affect Our Community?
Think about decisions made in your school or community What information might help make better choices? Share your ideas with a partner
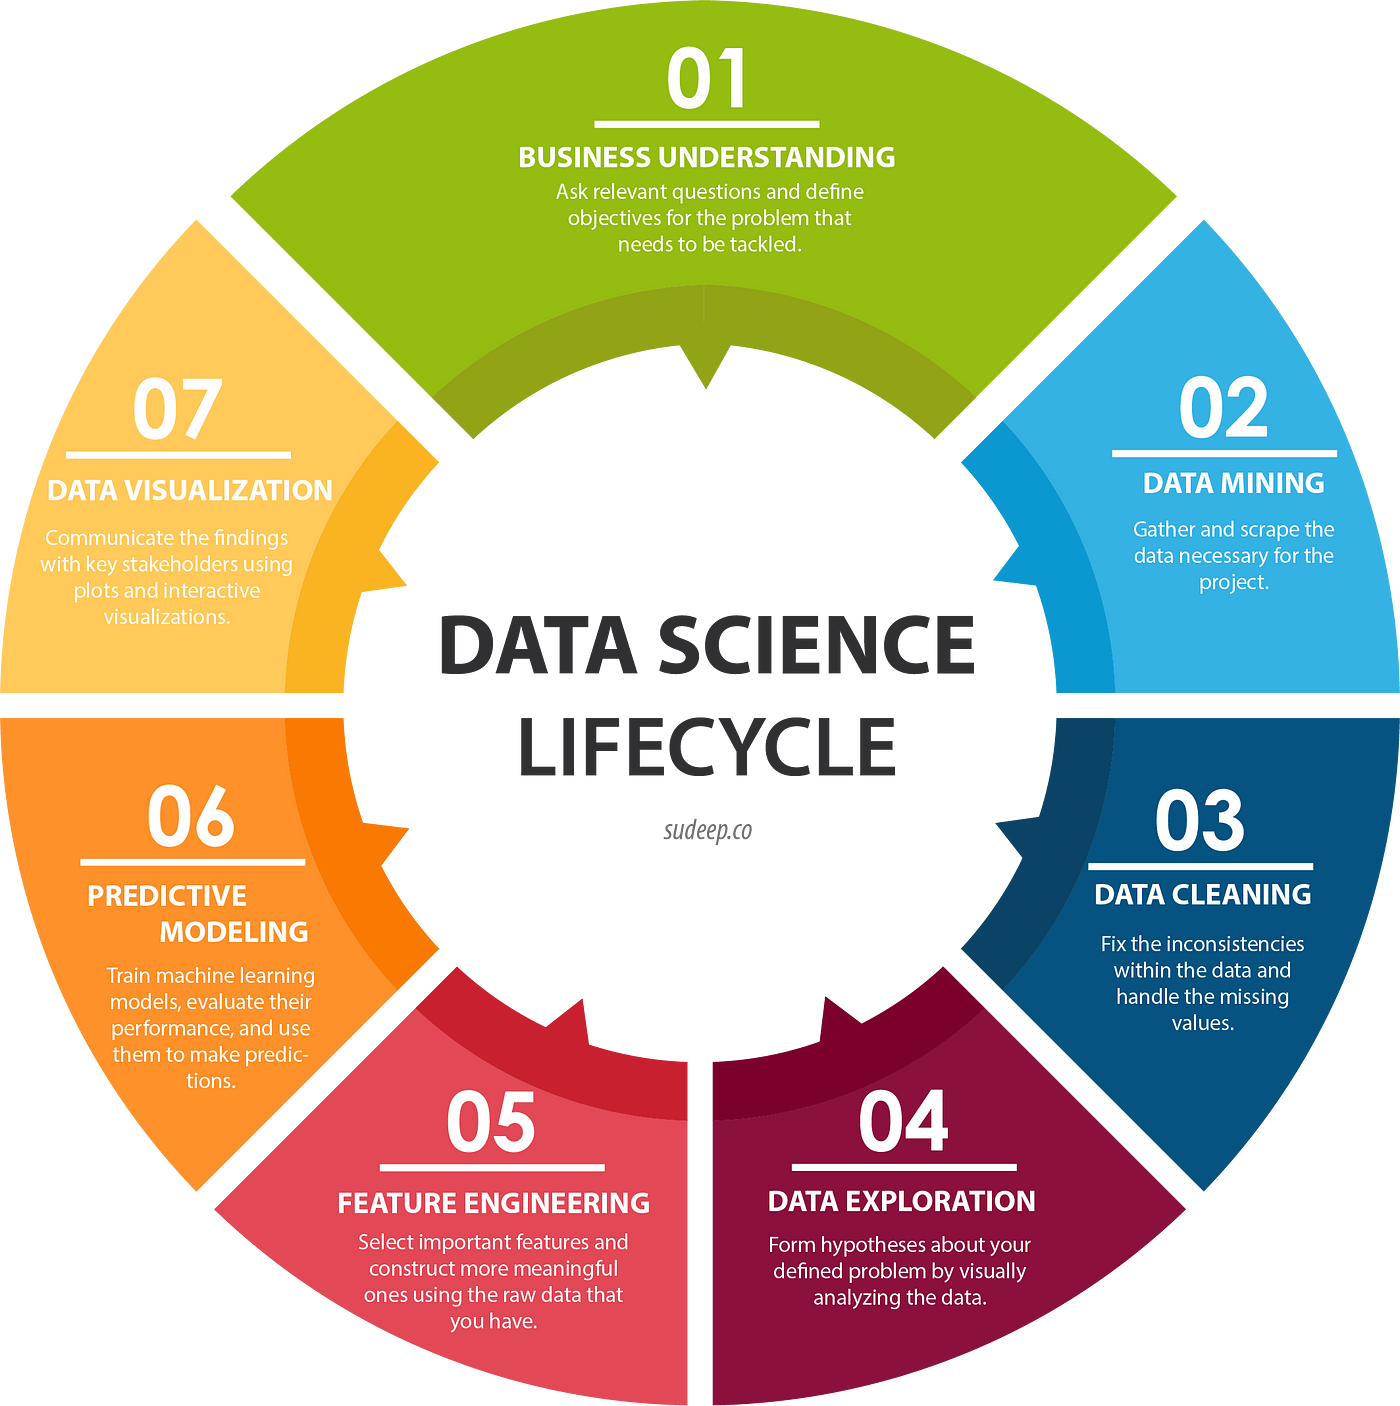
What Are Statistics?
The science of collecting, analyzing, and interpreting data Helps us make informed decisions Can influence positive changes in society Examples: improving health, environment, education

Sorting Data Types
Work in pairs to classify these examples Categorical: favourite sports, yes/no answers, colors Continuous: height, age, temperature, time Place each example in the correct category

Types of Data
{"left":"","right":"Continuous Data\nCan be measured and has infinite possible values\nExamples: height, weight, temperature, time"}

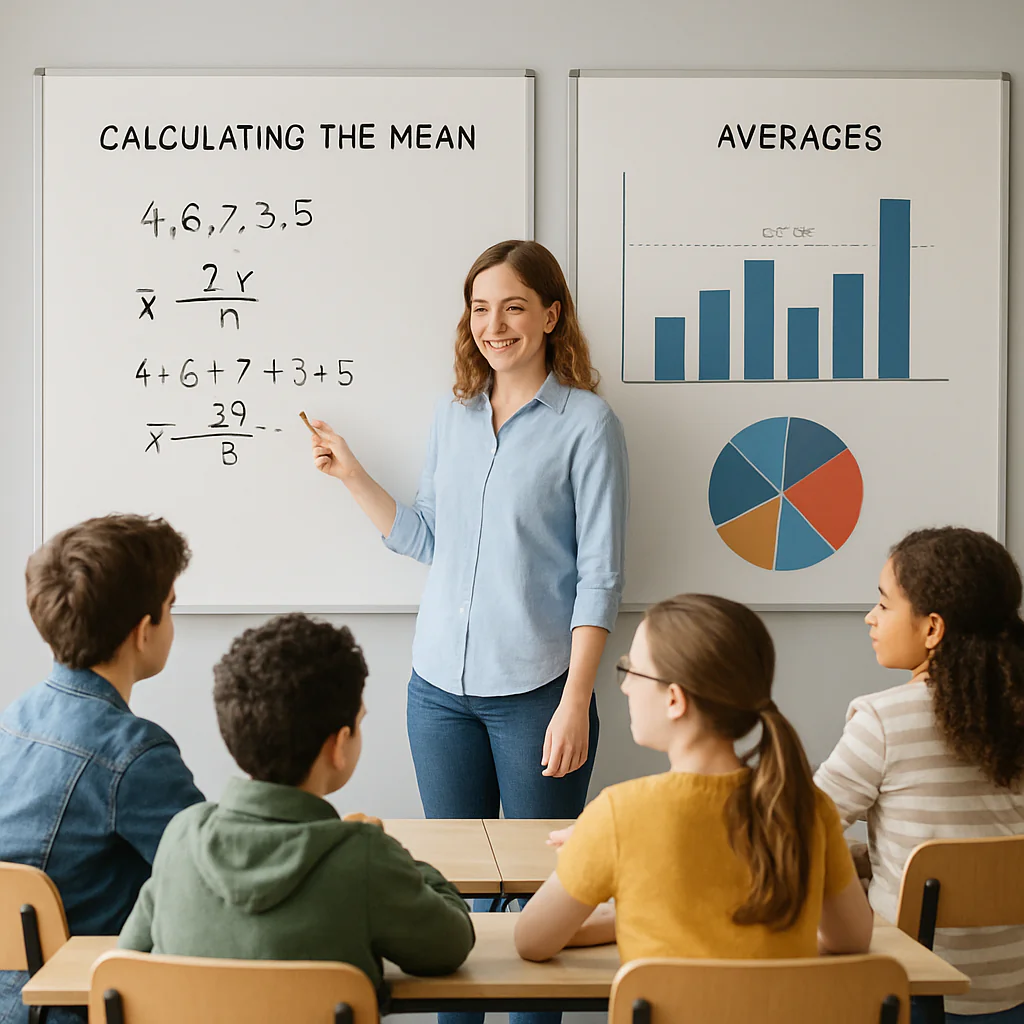
Measures of Central Tendency
Mean: the average of all values Median: the middle value when ordered Mode: the most frequently occurring value These help us understand what's 'typical' in our data
Calculate Central Tendency
Dataset: Hours of homework per week 8, 6, 10, 7, 8, 12, 8, 9, 6, 11 Calculate the mean, median, and mode Discuss: What do these numbers tell us about homework habits?

Statistics: A Tool for Change
'In God we trust, all others must bring data.' - W. Edwards Deming How can statistics help solve social issues in our community?