MathsFreePrintable
Chart Types in Statistics
A free maths worksheet ready for your classroom. Open in Kuraplan to grab the print-ready PDF, customize it for your students, or generate a fresh version in seconds.
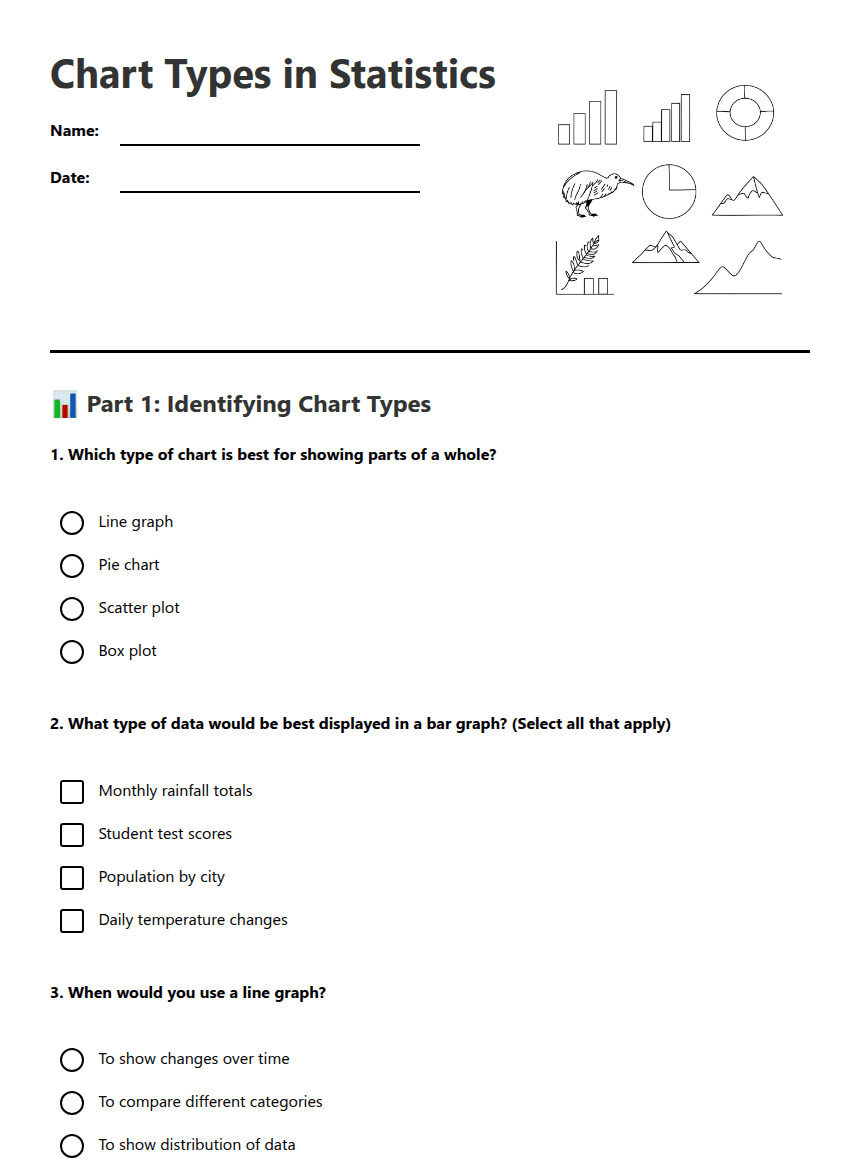
Chart Types in Statistics
📊 Part 1: Identifying Chart Types
1. Which type of chart is best for showing parts of a whole?
Line graph
Pie chart
Scatter plot
Box plot
2. What type of data would be best displayed in a bar graph? (Select all that apply)
Monthly rainfall totals
Student test scores
Population by city
Daily temperature changes
3. When would you use a line graph?
To show changes over time
To compare different categories
To show distribution of data
To display percentages of a whole
📈 Part 2: Chart Analysis
4. A pie chart shows these sections: 25%, 30%, 15%, and 30%. What might this data represent?
5. You are tracking the temperature each day for a week. Which chart type would be most appropriate and why?
6. Draw a simple bar graph showing the following data:
Ice cream sales by flavour:
Chocolate: 45 units
Vanilla: 30 units
Strawberry: 25 units
About This Worksheet
Free in Kuraplan
Sign up free, grab the PDF, and customize it for your class.
Print-Ready
Formatted for standard paper. Clean layout, easy to read.
AI-Generated
Created with Kuraplan's AI, designed for real classroom use.
For Teachers & Parents
Use in classrooms, for homework, tutoring, or homeschool.
Need a custom version of this worksheet?
Kuraplan's AI generates custom worksheets in seconds — differentiated for every learner, aligned to your curriculum.
Generate Custom Worksheets — Free No credit card Curriculum-aligned Under 60 seconds
More Maths Worksheets
Year 4
Year 4 Maths Placement Test
Free
Year 11
Functional Skills Maths Revision
Free
Year 11–13
Functional Skills Maths Assessment
Free
Year 11–13
Functional Skills Maths Practice
Free
Year 5–7
Maths Trivia Team Challenge
Free
Year 9
Year 9 Maths Revision
Free
Year 10
Year 10 Measurement Maths
Free
Year 8–9