Data Display Matching
A free maths worksheet ready for your classroom. Open in Kuraplan to grab the print-ready PDF, customize it for your students, or generate a fresh version in seconds.
Data Display Matching
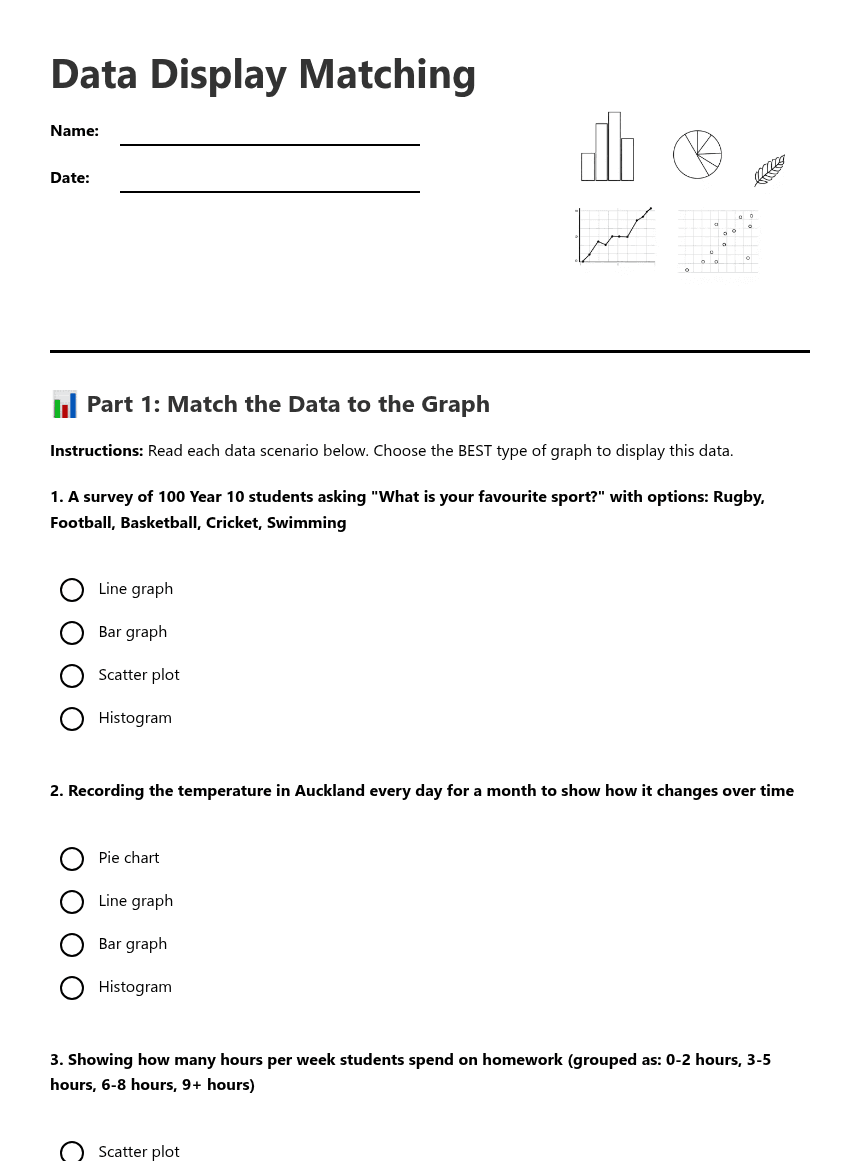
📊 Part 1: Match the Data to the Graph
Instructions: Read each data scenario below. Choose the BEST type of graph to display this data.
🎯 Part 2: Data Type Classification
Categorical data (favourite colours):
Continuous data (heights of students):
💡 Extension Challenge
My data scenario:
Best graph type and why:
📝 Support Notes
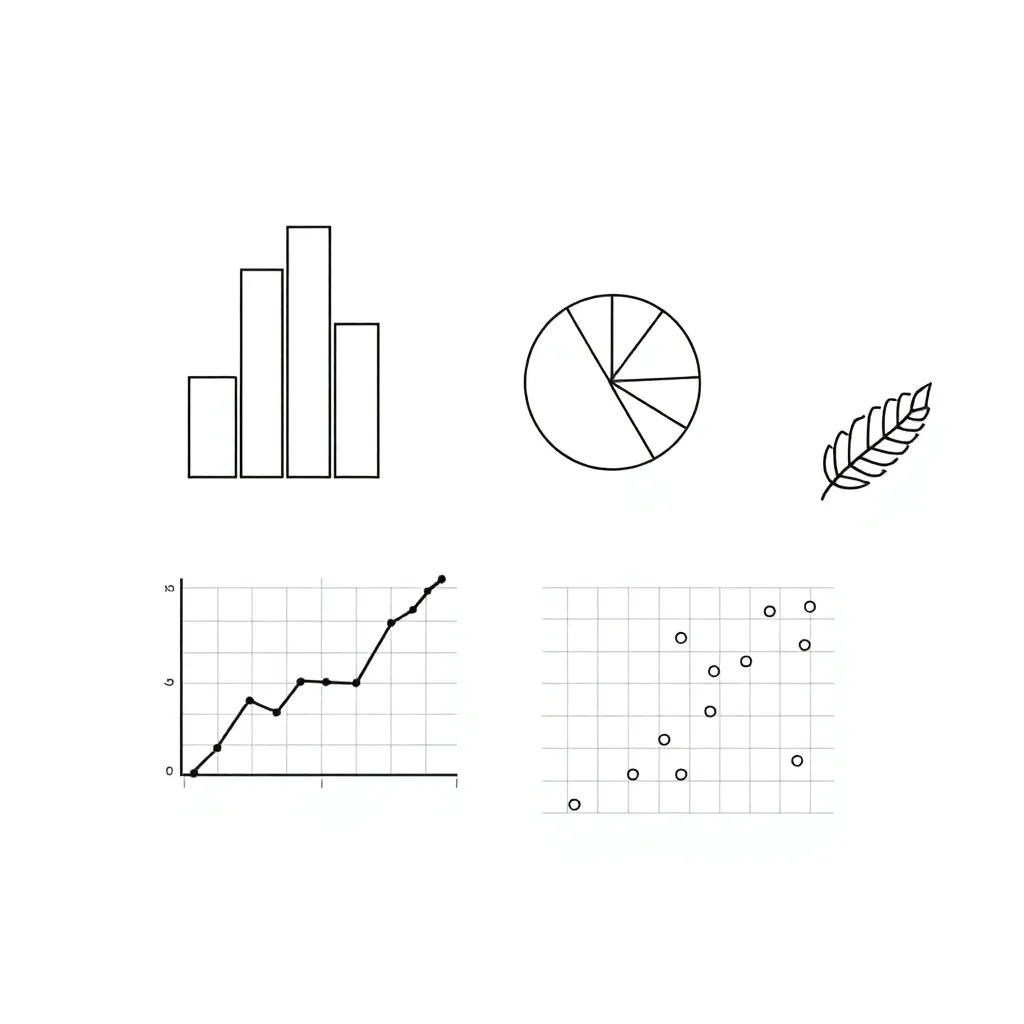
Graph Types Quick Reference:
• Bar Graph: Comparing categories (favourite sports, eye colours)
• Line Graph: Showing change over time (temperature, population growth)
• Histogram: Showing frequency of grouped continuous data (ages, test scores)
• Pie Chart: Showing parts of a whole (budget breakdown, survey results)
• Scatter Plot: Showing relationships between two variables (height vs shoe size)
About This Worksheet
Free in Kuraplan
Sign up free, grab the PDF, and customize it for your class.
Print-Ready
Formatted for standard paper. Clean layout, easy to read.
AI-Generated
Created with Kuraplan's AI, designed for real classroom use.
For Teachers & Parents
Use in classrooms, for homework, tutoring, or homeschool.
Need a custom version of this worksheet?
Kuraplan's AI generates custom worksheets in seconds — differentiated for every learner, aligned to your curriculum.
Generate Custom Worksheets — FreeMore Maths Worksheets
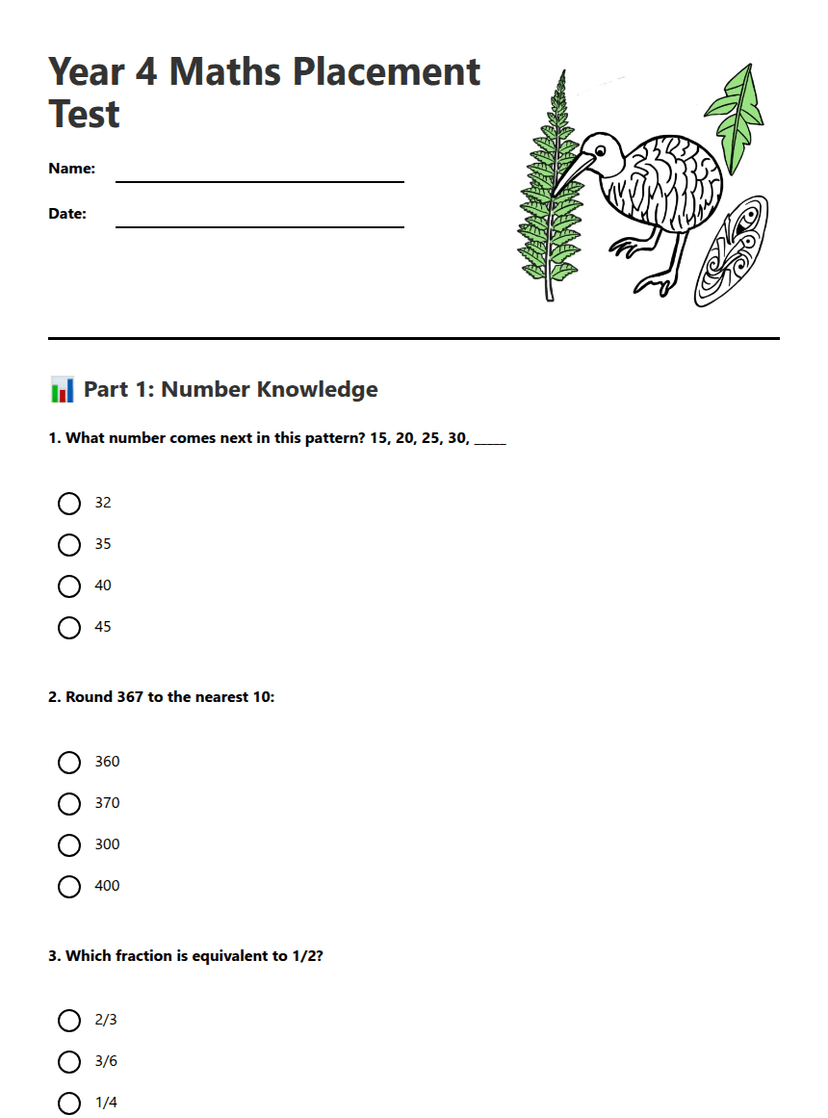
Year 4 Maths Placement Test
Free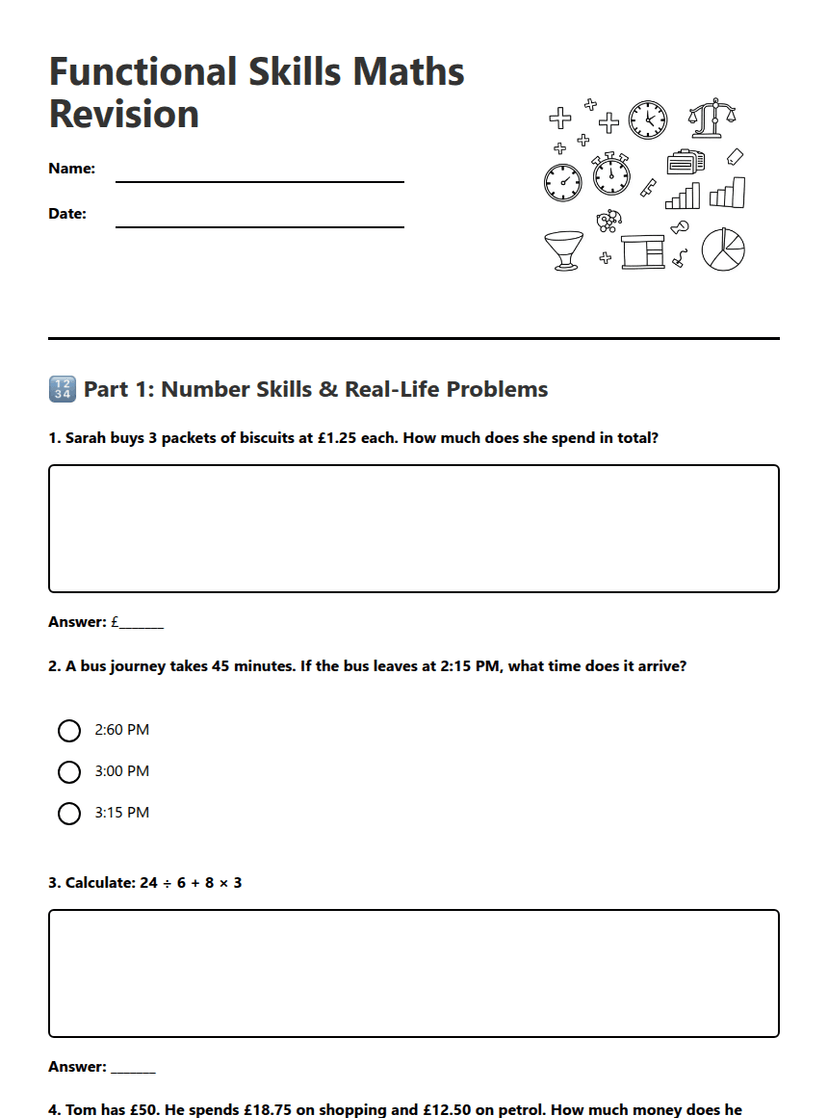
Functional Skills Maths Revision
Free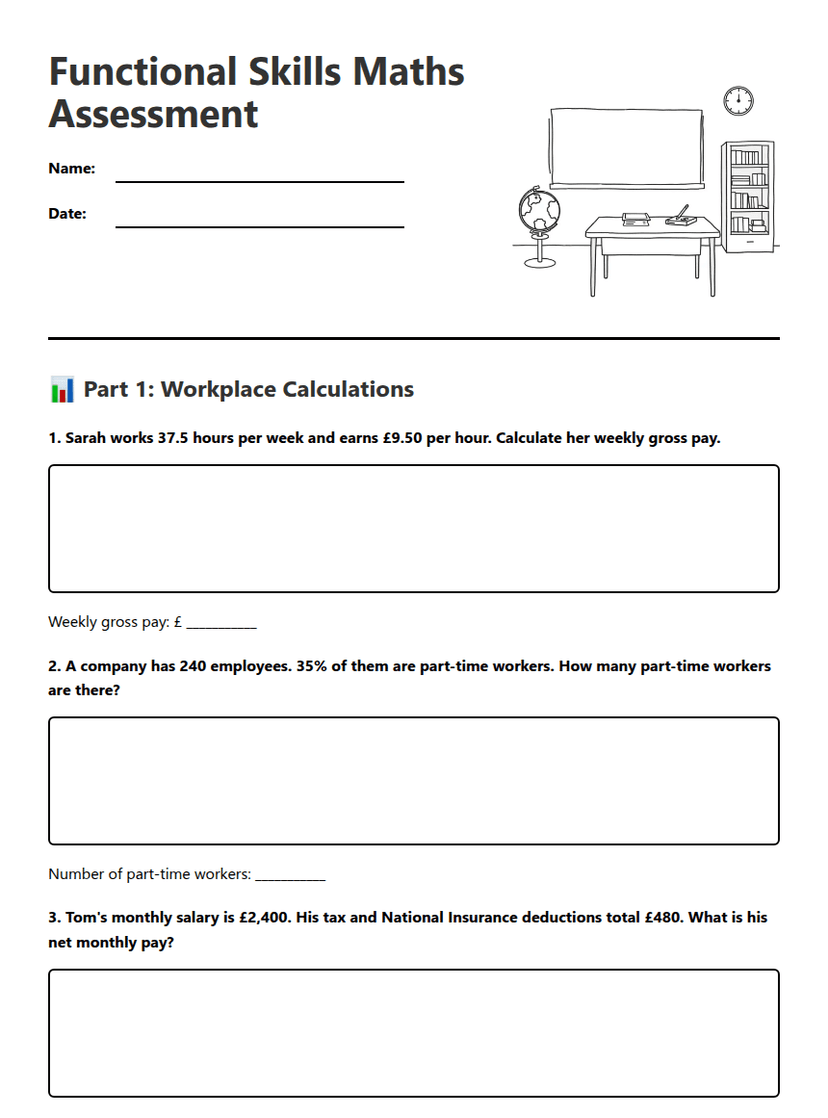
Functional Skills Maths Assessment
Free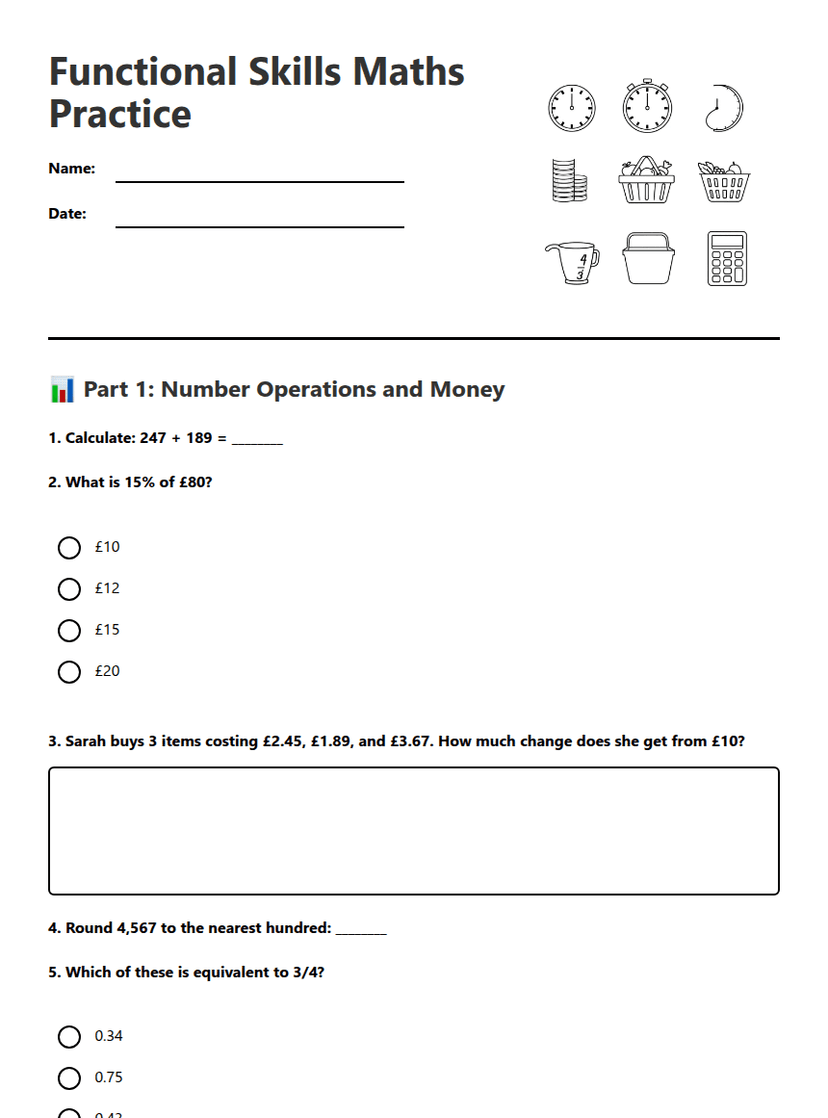
Functional Skills Maths Practice
Free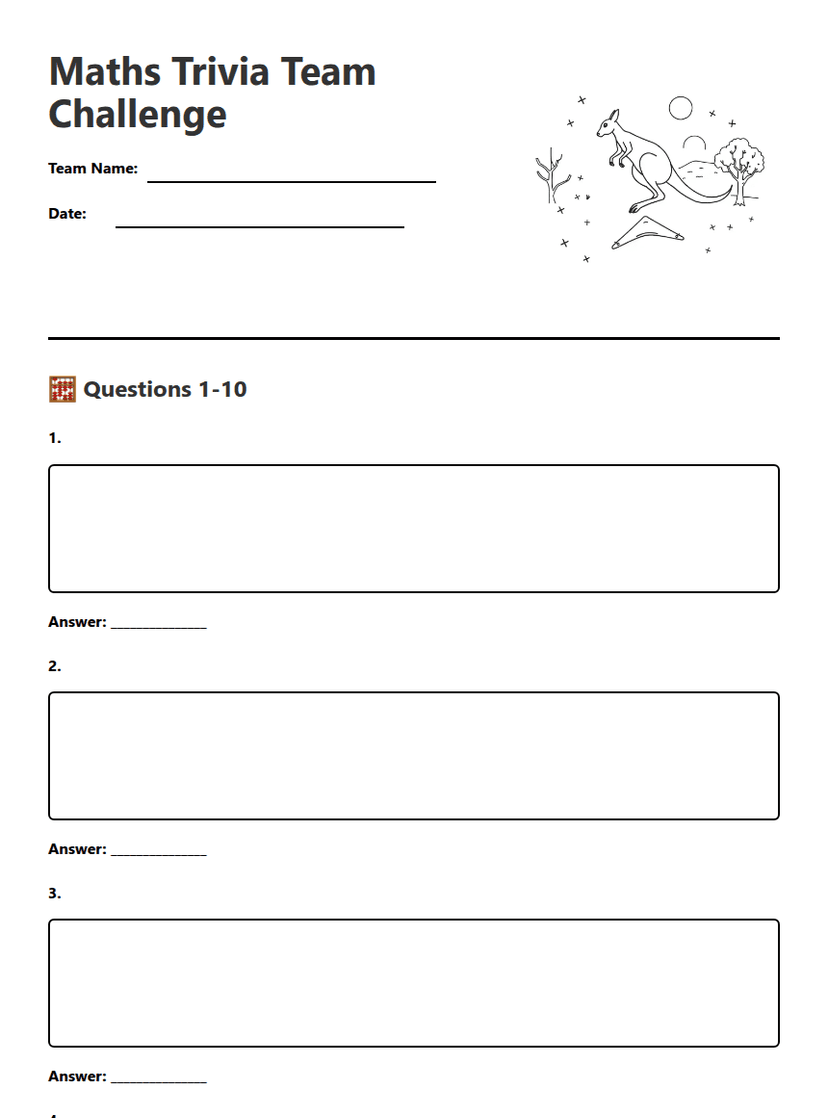
Maths Trivia Team Challenge
Free
Year 9 Maths Revision
Free
Year 10 Measurement Maths
Free