Non-Price Supply Factors
A free social sciences worksheet ready for your classroom. Open in Kuraplan to grab the print-ready PDF, customize it for your students, or generate a fresh version in seconds.
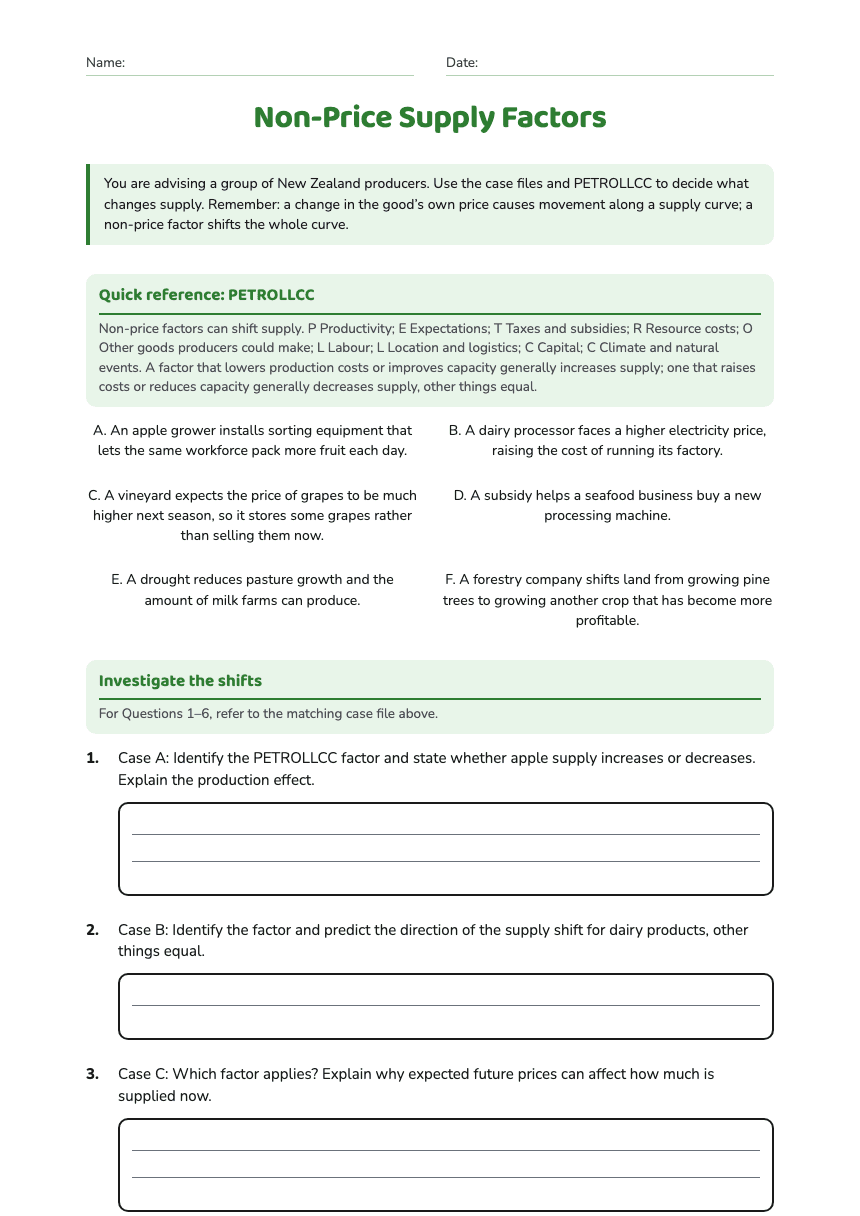
Non-Price Supply Factors
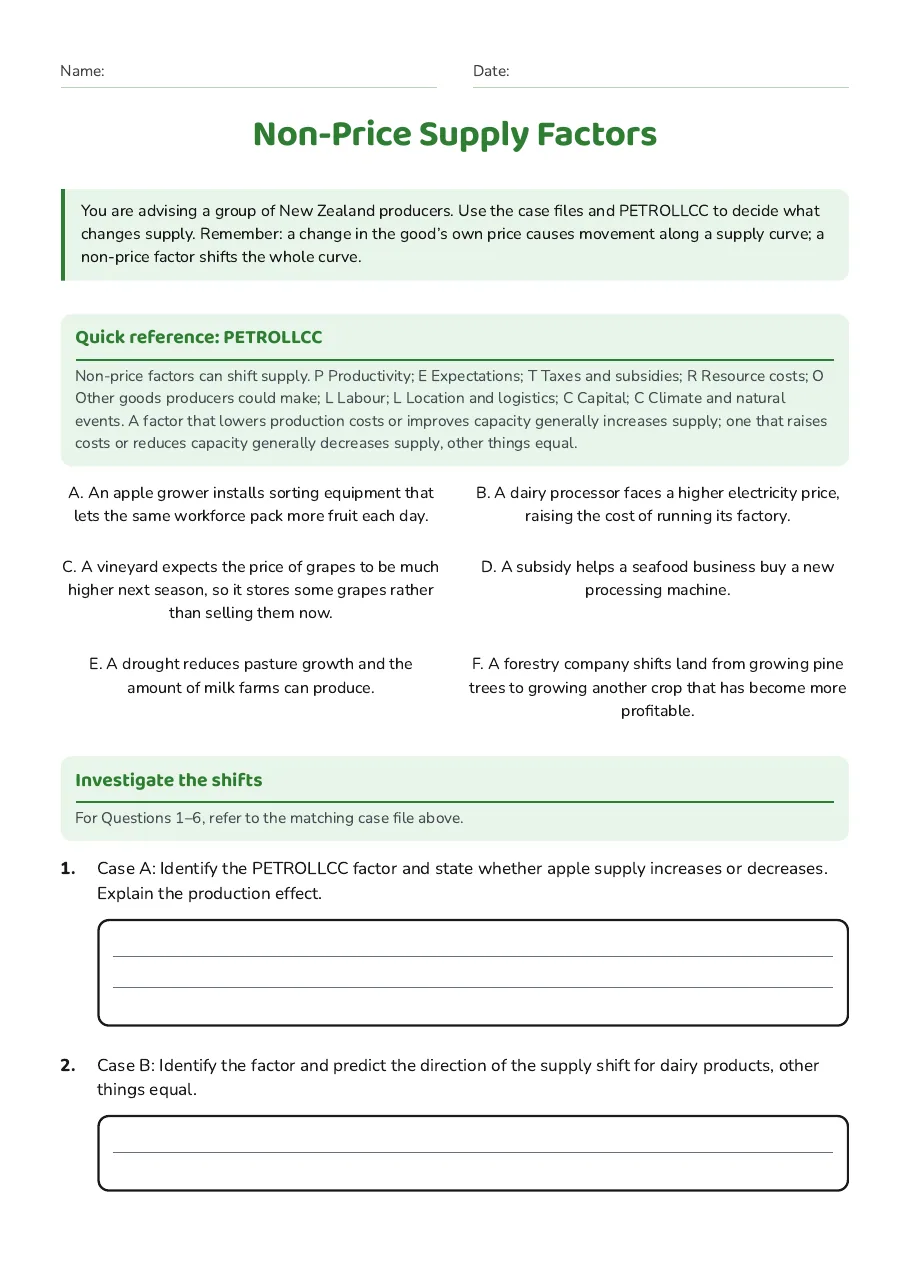
Quick reference: PETROLLCC
Non-price factors can shift supply. P Productivity; E Expectations; T Taxes and subsidies; R Resource costs; O Other goods producers could make; L Labour; L Location and logistics; C Capital; C Climate and natural events. A factor that lowers production costs or improves capacity generally increases supply; one that raises costs or reduces capacity generally decreases supply, other things equal.
A. An apple grower installs sorting equipment that lets the same workforce pack more fruit each day.
B. A dairy processor faces a higher electricity price, raising the cost of running its factory.
C. A vineyard expects the price of grapes to be much higher next season, so it stores some grapes rather than selling them now.
D. A subsidy helps a seafood business buy a new processing machine.
E. A drought reduces pasture growth and the amount of milk farms can produce.
F. A forestry company shifts land from growing pine trees to growing another crop that has become more profitable.
Investigate the shifts
For Questions 1–6, refer to the matching case file above.
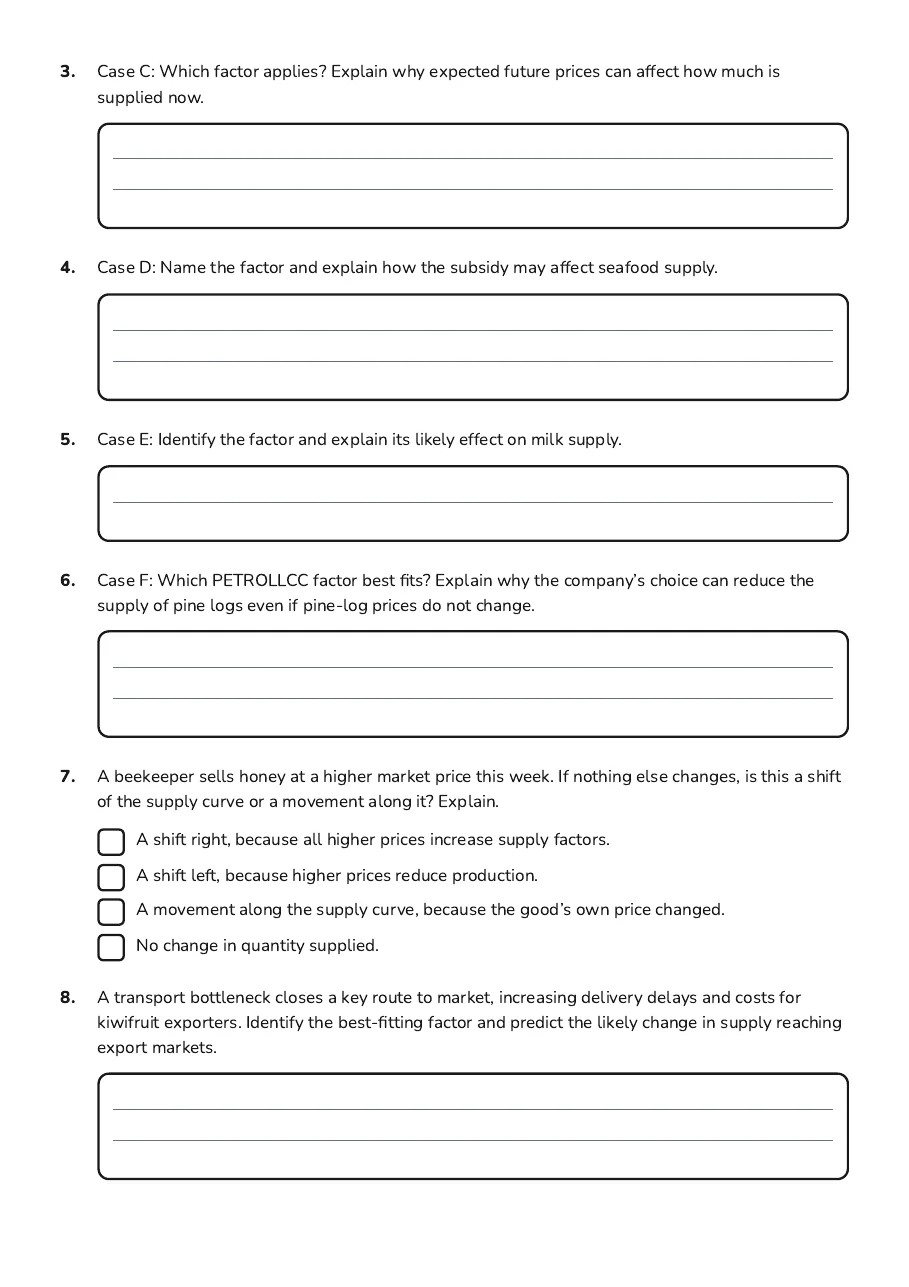
- A shift right, because all higher prices increase supply factors.
- A shift left, because higher prices reduce production.
- A movement along the supply curve, because the good’s own price changed.
- No change in quantity supplied.
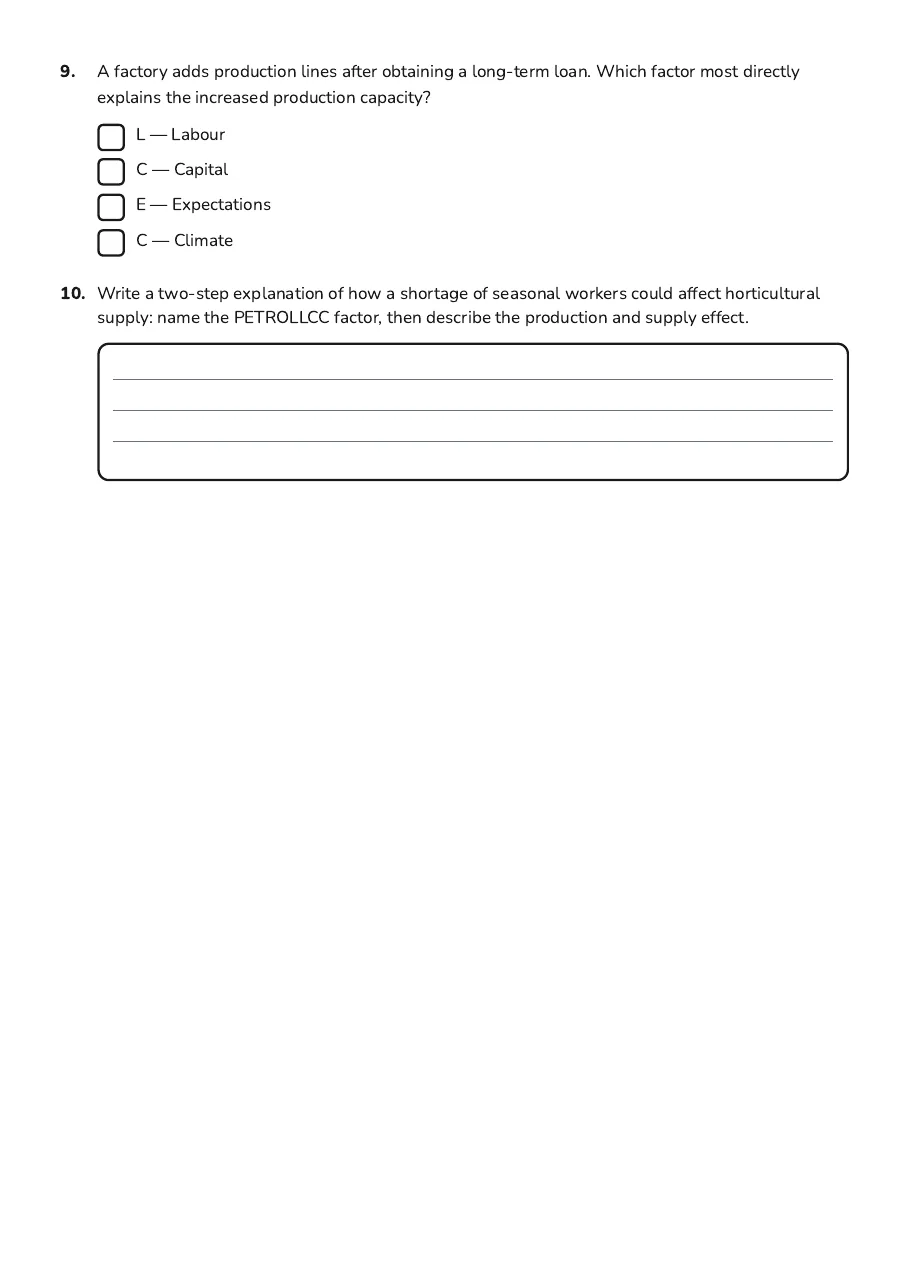
- L — Labour
- C — Capital
- E — Expectations
- C — Climate
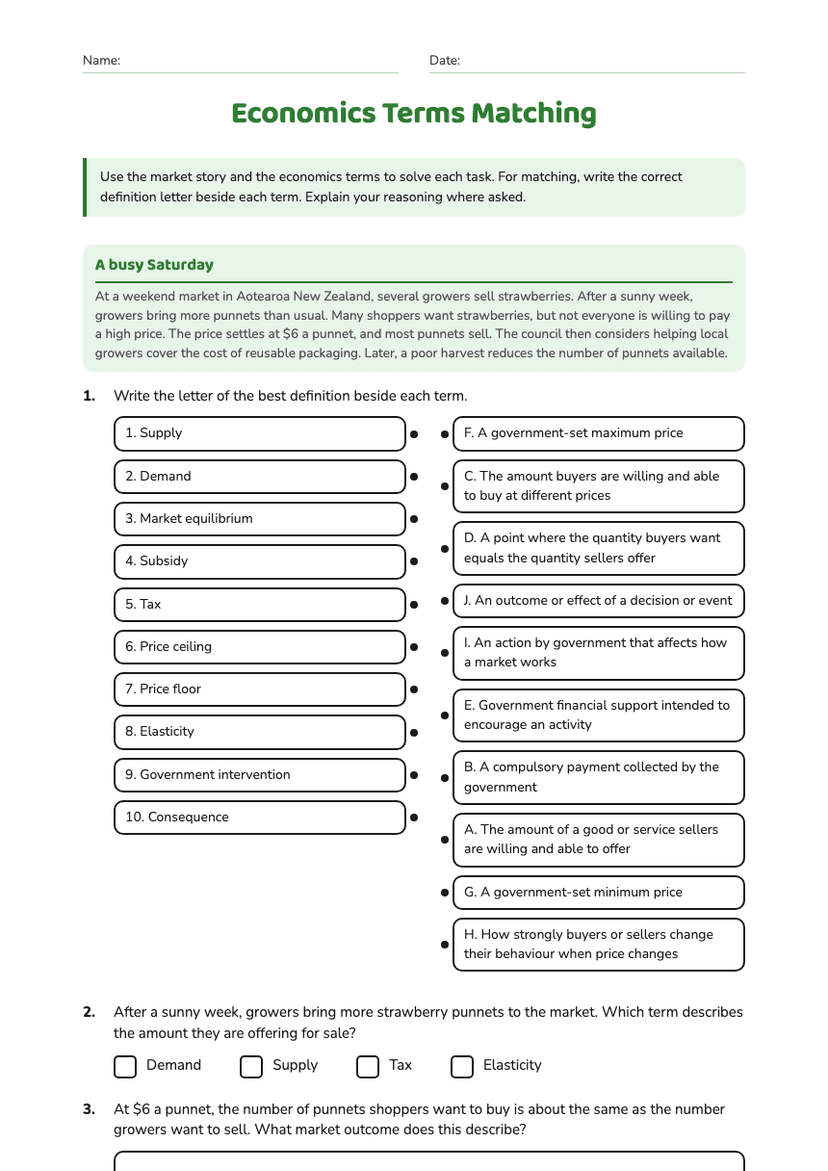
3 printable pages
Page 1
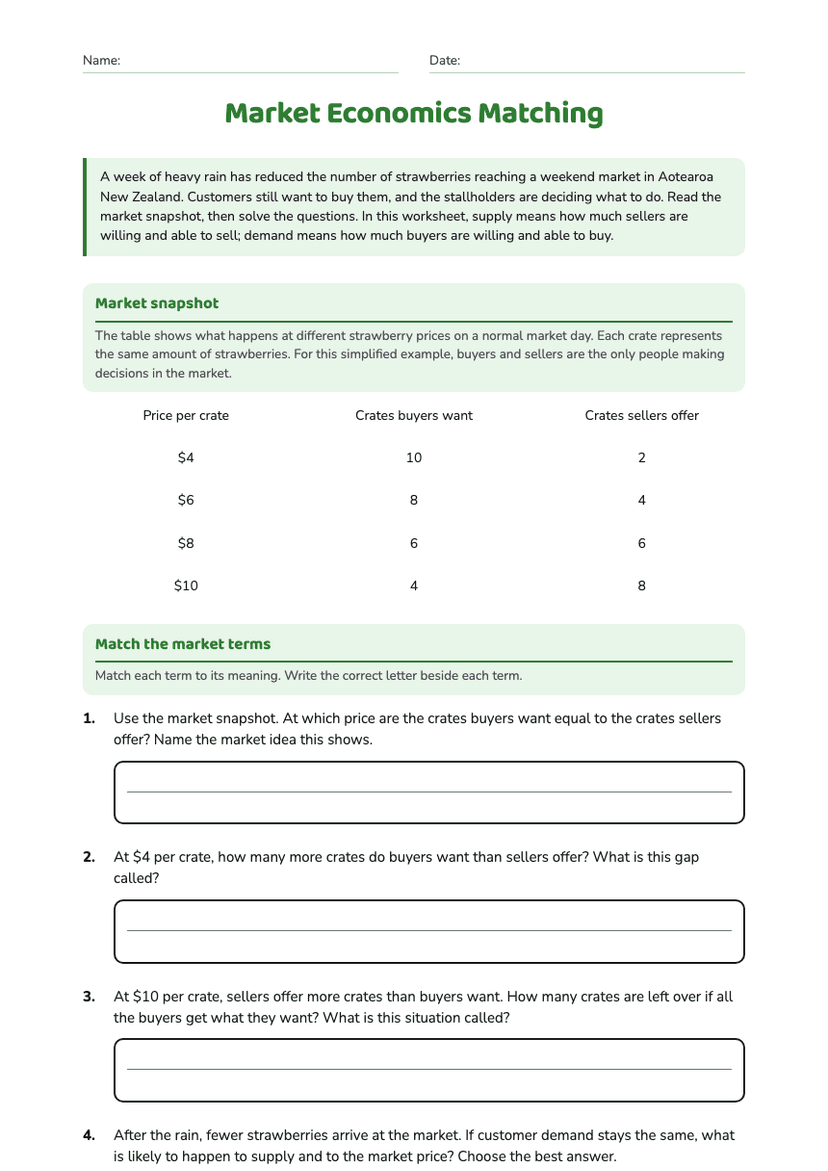
Page 2
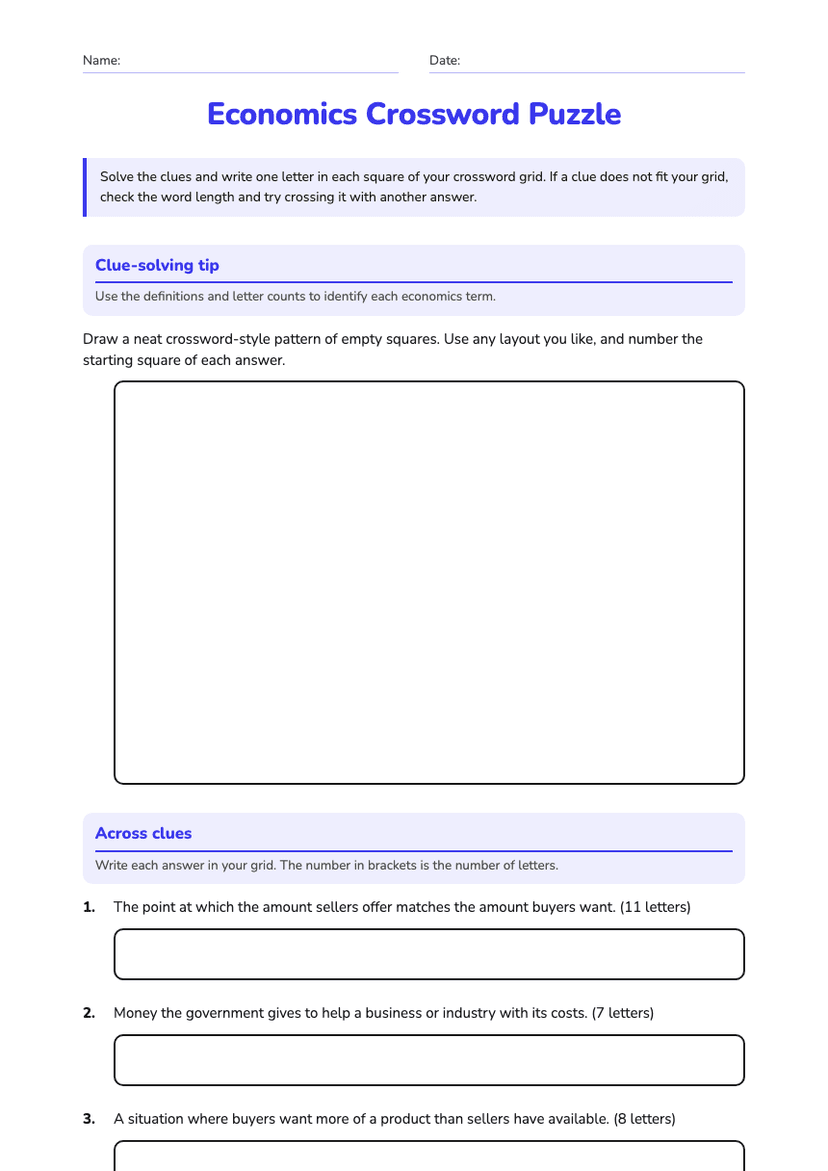
Page 3
About This Worksheet
Free in Kuraplan
Sign up free, grab the PDF, and customize it for your class.
Print-Ready
Formatted for standard paper. Clean layout, easy to read.
AI-Generated
Created with Kuraplan's AI, designed for real classroom use.
For Teachers & Parents
Use in classrooms, for homework, tutoring, or homeschool.
Need a custom version of this worksheet?
Kuraplan's AI generates custom worksheets in seconds — differentiated for every learner, aligned to your curriculum.
Generate Custom Worksheets — Free