Statistics: Mean, Variance, and Standard Deviation
Understanding measures of central tendency and spread Formulas and applications Year 13 Mathematics
Learning Objectives
Define mean, variance, and standard deviation State the mathematical formulas for each measure Understand when and why to use each measure Apply these concepts to real-world data sets
What is the Mean?
The arithmetic average of a data set Sum of all values divided by the number of values Represented by the symbol x̄ (x-bar) or μ (mu) Most commonly used measure of central tendency
Mean Formula
x̄ = (x₁ + x₂ + x₃ + ... + xₙ) / n Where x̄ is the mean, x₁, x₂, etc. are individual values, and n is the number of values
Calculate the Mean
Data set: 12, 15, 18, 20, 25 Step 1: Add all values Step 2: Divide by the number of values What is the mean of this data set?
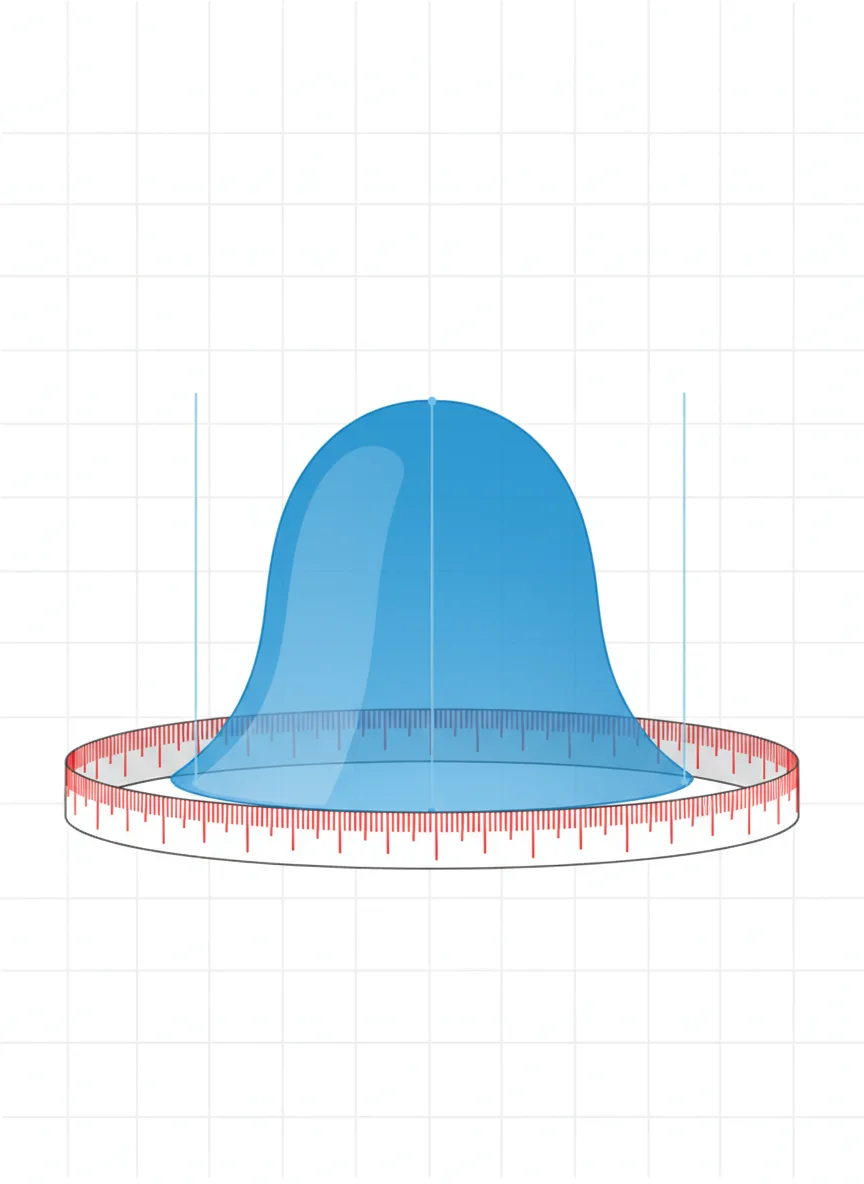
Understanding Variance
Measures how spread out the data is from the mean Shows the average of squared differences from the mean Larger variance = more spread out data Represented by σ² (sigma squared) or s²
Variance Formula
σ² = Σ(x - μ)² / n Where σ² is variance, x represents each value, μ is the mean, and n is the number of values
Standard Deviation Explained
The square root of the variance Measures spread in the same units as the original data More intuitive than variance for interpretation Represented by σ (sigma) or s

Comparing the Three Measures
{"left":"Mean: Central tendency, where data clusters\nVariance: Spread in squared units, hard to interpret directly","right":"Standard deviation: Spread in original units, easy to interpret\nAll three work together to describe data completely"}
Summary and Key Takeaways
Mean: x̄ = Σx / n (measures central tendency) Variance: σ² = Σ(x - μ)² / n (measures spread, squared units) Standard deviation: σ = √variance (measures spread, original units) These measures help us understand and describe data patterns