Year 4 Discrete Data Diagrams
Learning to represent and interpret data Using bar charts and pictograms Year 4 Mathematics - Statistics
What is Discrete Data?
Data we can count in separate categories Examples: number of pets, favourite fruits, types of transport Different from continuous data (like height or time) Each piece of data is distinct and separate
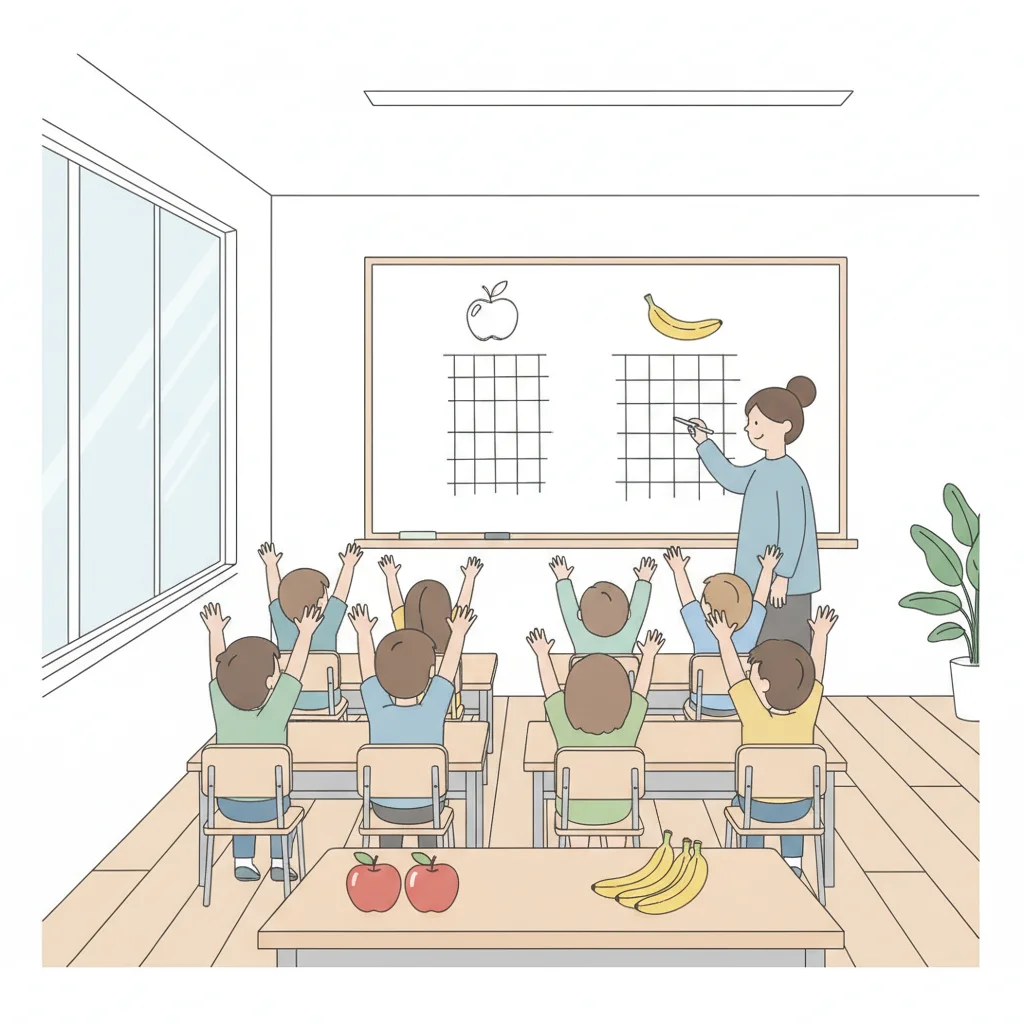
Let's Collect Some Data!
Quick class survey: What's your favourite fruit? Count the responses together Organize the data into categories Prepare to create our first diagram
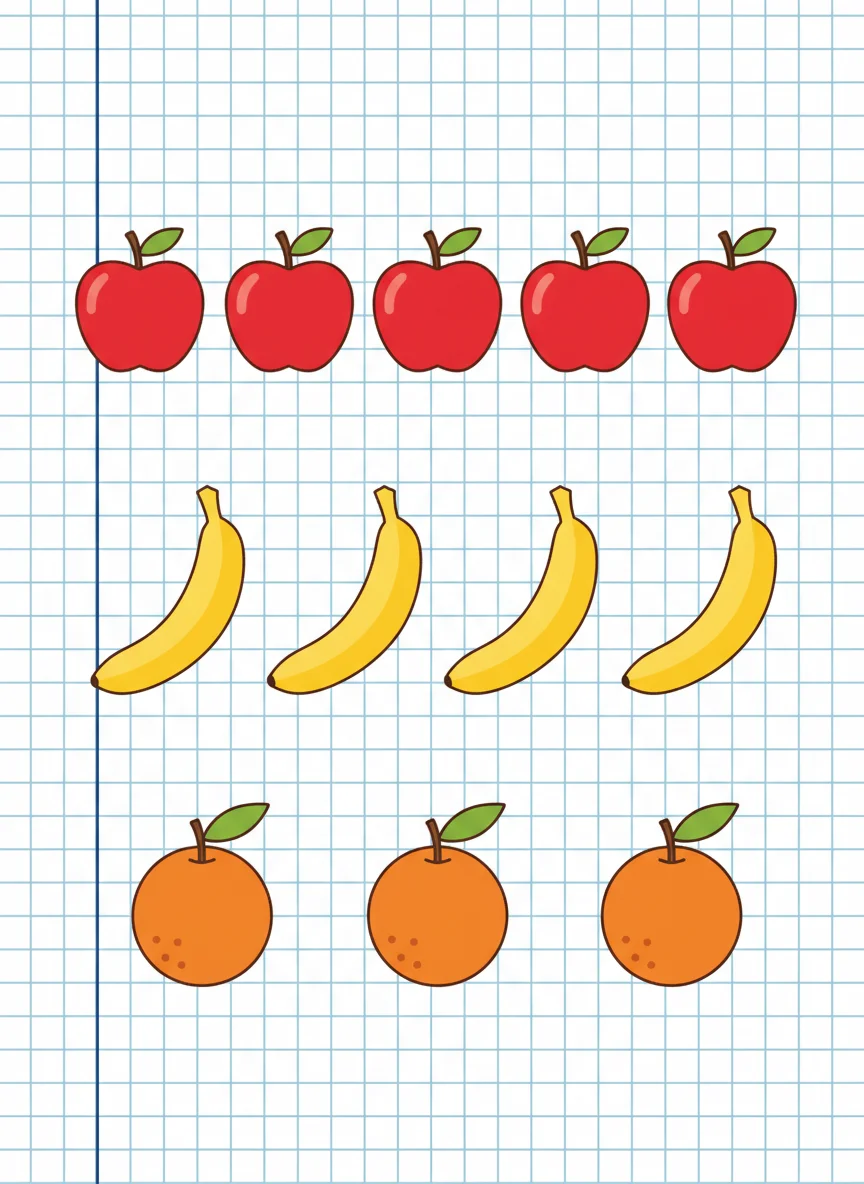
Creating Pictograms
Use symbols or pictures to represent data Each symbol represents one item Line up symbols in rows for each category Don't forget to add a title and labels
Pictograms vs Bar Charts
{"left":"Pictograms use symbols or pictures\nEach symbol = one item\nGood for small amounts of data\nFun and visual","right":"Bar charts use rectangular bars\nHeight shows the amount\nGood for comparing data\nEasy to read exact numbers"}

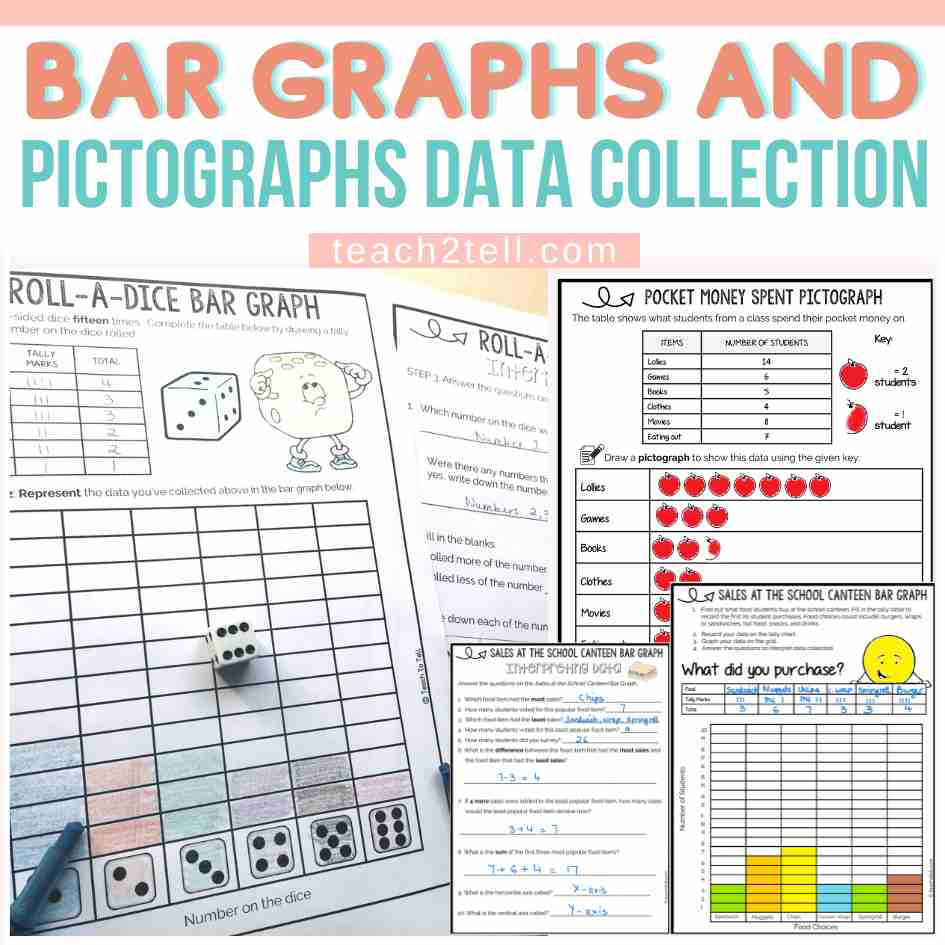
Hands-On Practice
Work in pairs to create both diagrams Choose: transport to school OR favourite sport Make a pictogram using stickers Make a bar chart on graph paper Compare your results with other pairs
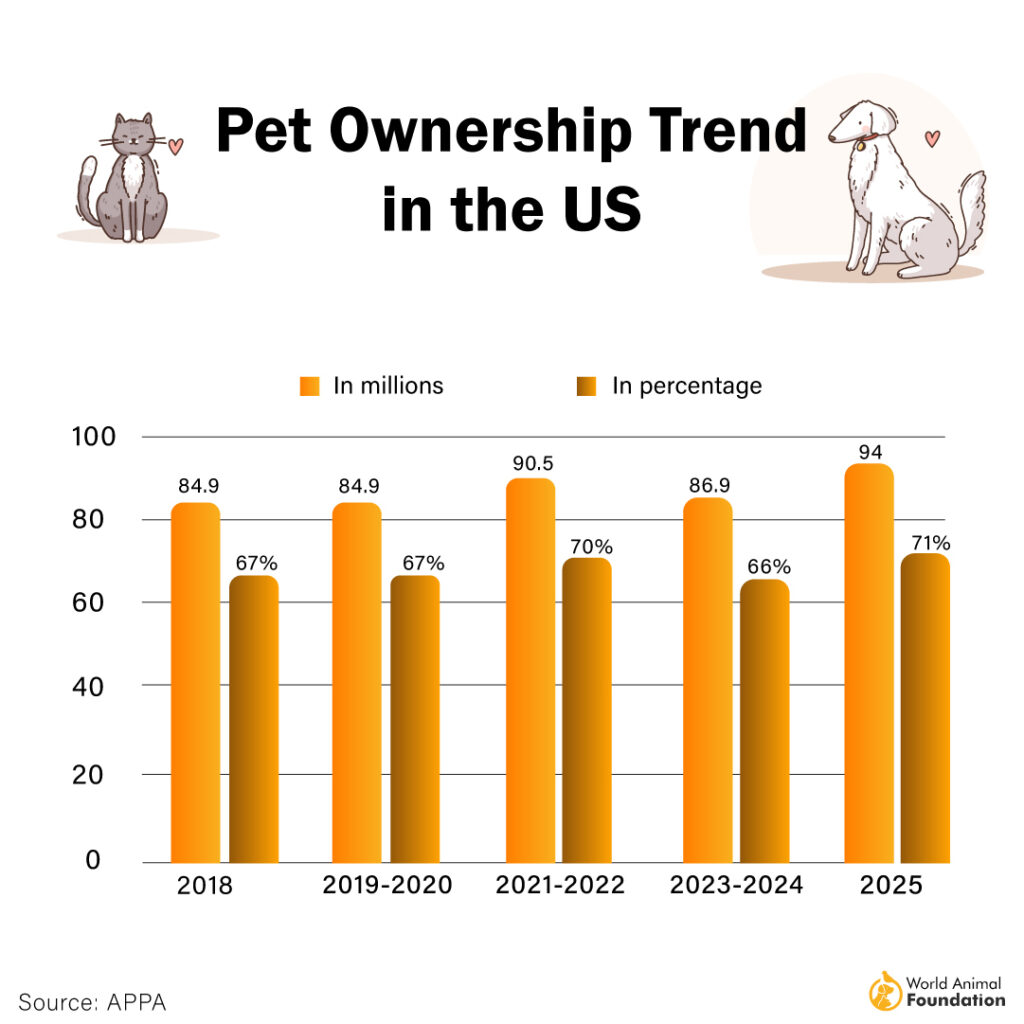
Reading Data Diagrams
Look at this bar chart about pets: Which pet is most popular? How many more people have dogs than fish? What's the total number of pets?

What We've Learned Today
Discrete data can be counted and organized Pictograms use symbols to show data Bar charts use bars to compare amounts Both help us understand information quickly We can solve problems using data diagrams