
Year 4 Discrete Data Diagrams
Learning to collect, organise and represent data Using bar charts and pictograms Year 4 Mathematics
What is Discrete Data?
Data we can count in separate groups Things like number of pets, favourite colours, or types of transport Different from continuous data (like height or time) Examples: 5 cats, 3 dogs, 2 hamsters
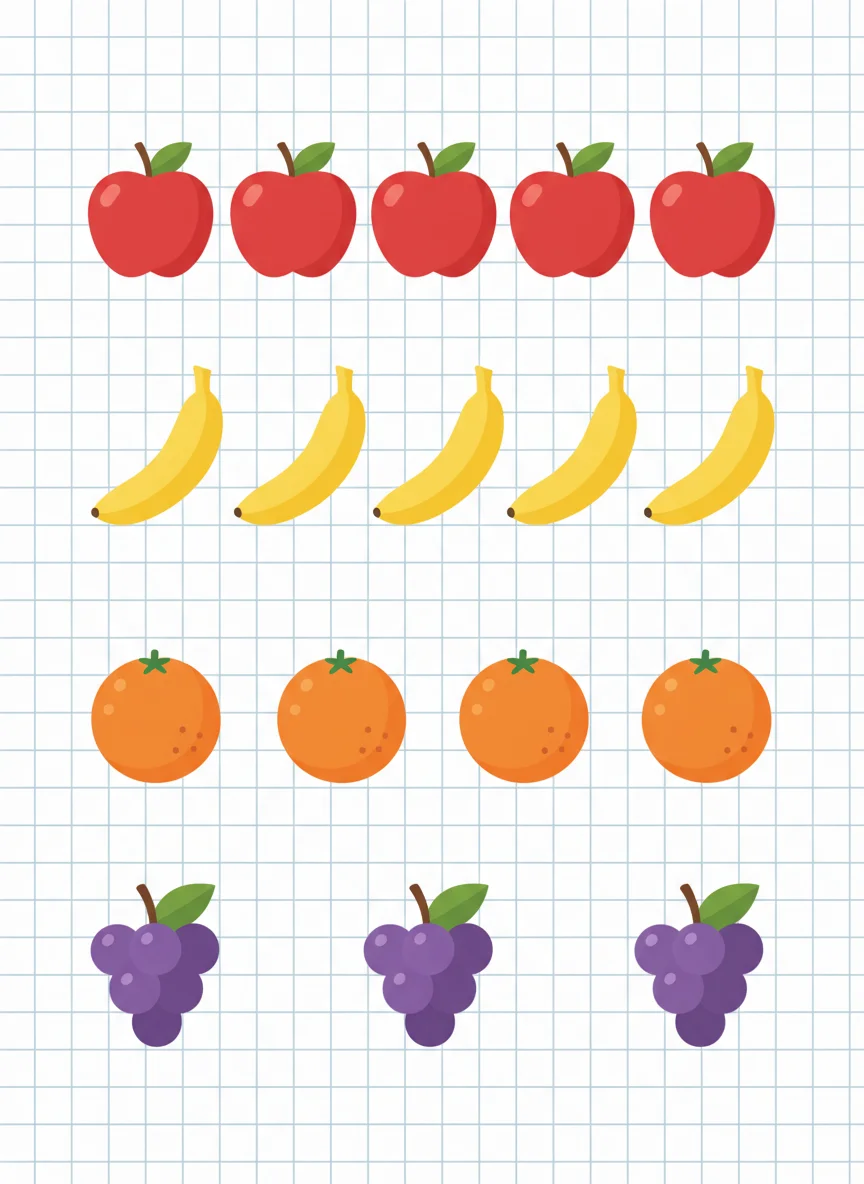
Let's Collect Some Data!
Survey: What's your favourite fruit? Count the responses for each fruit Apple, Banana, Orange, Grapes Write down the numbers for each category
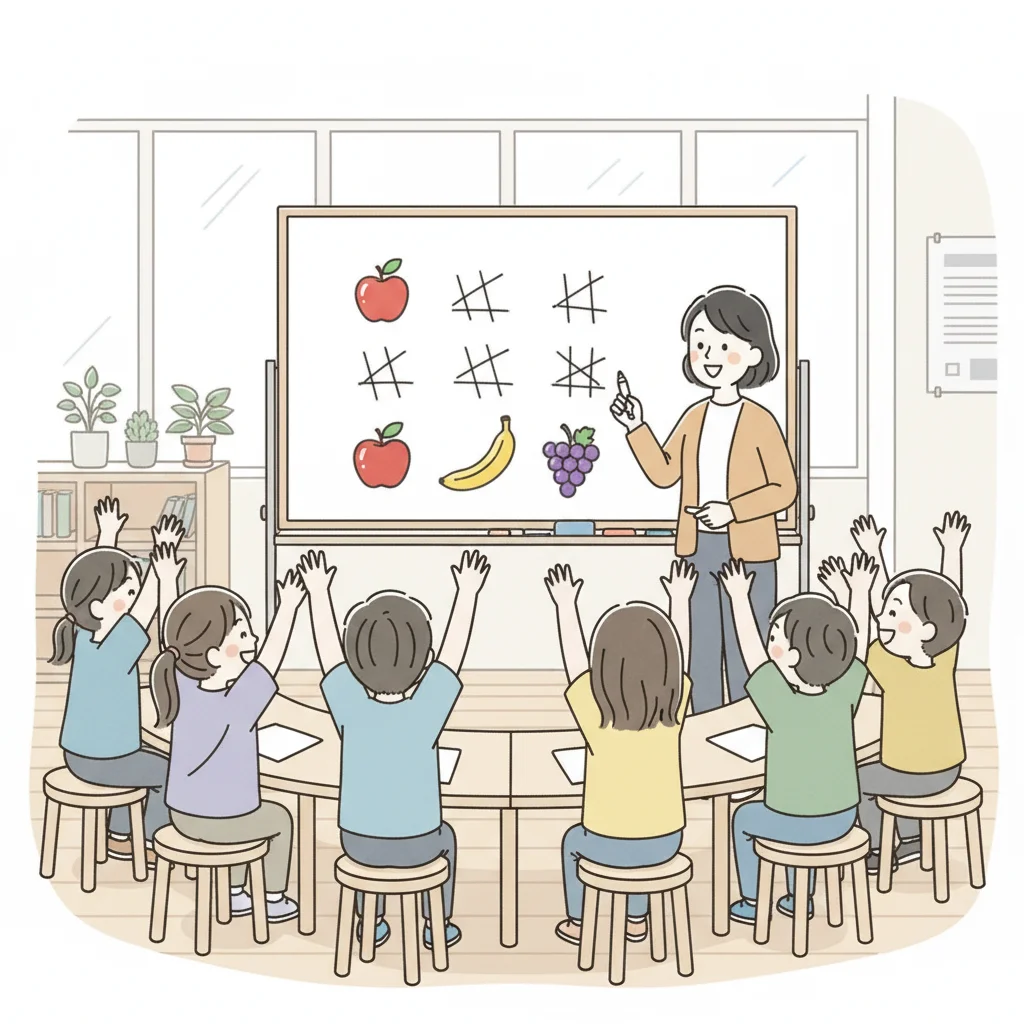
Creating a Pictogram
Each picture represents one person Use simple symbols like smiley faces or stickers Line up symbols in rows for each category Easy to see which group has the most

Making a Bar Chart
Draw bars going up for each category Height of bar shows how many Use graph paper for neat, equal squares Don't forget labels and a title!
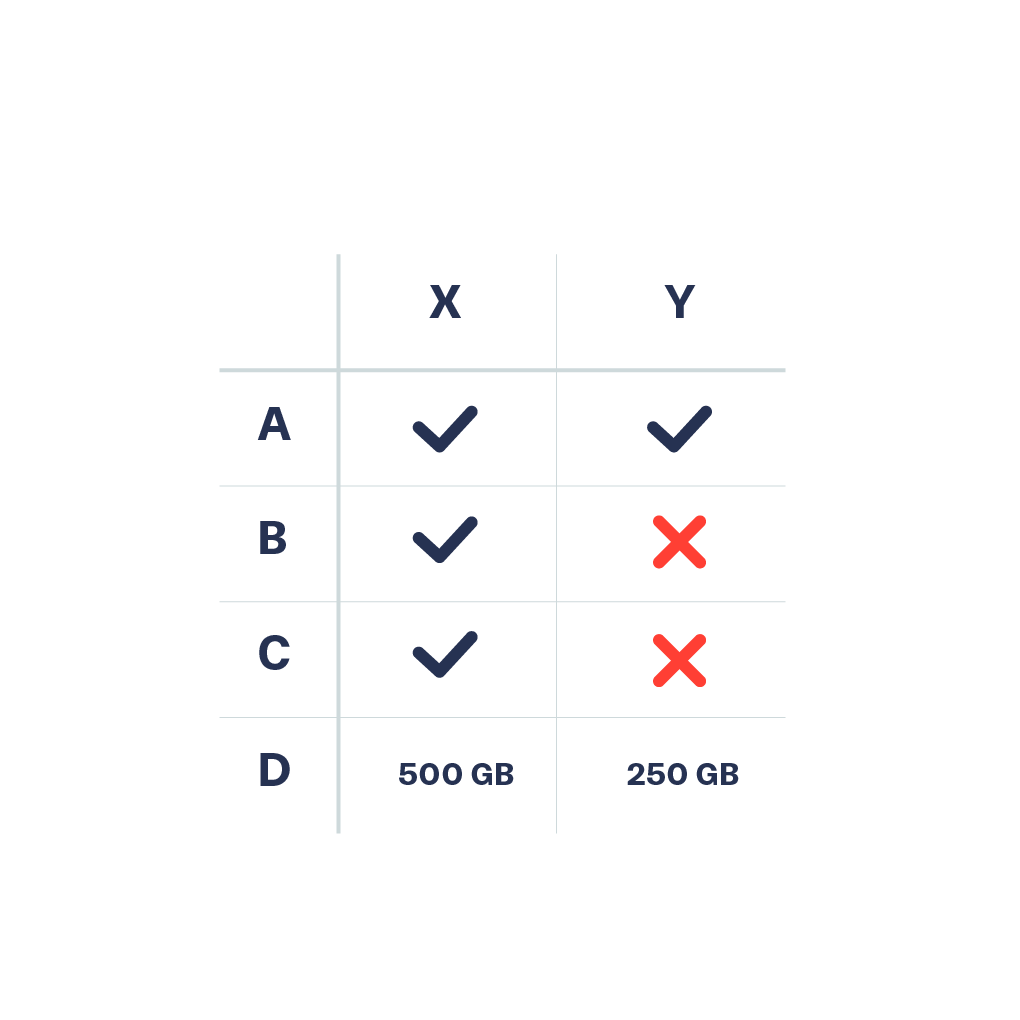
Pictogram vs Bar Chart
{"left":"Uses pictures or symbols\nEach symbol = 1 person\nEasy to understand quickly\nFun and colorful","right":"Uses bars of different heights\nHeight shows the amount\nMore precise measurements\nProfessional looking"}
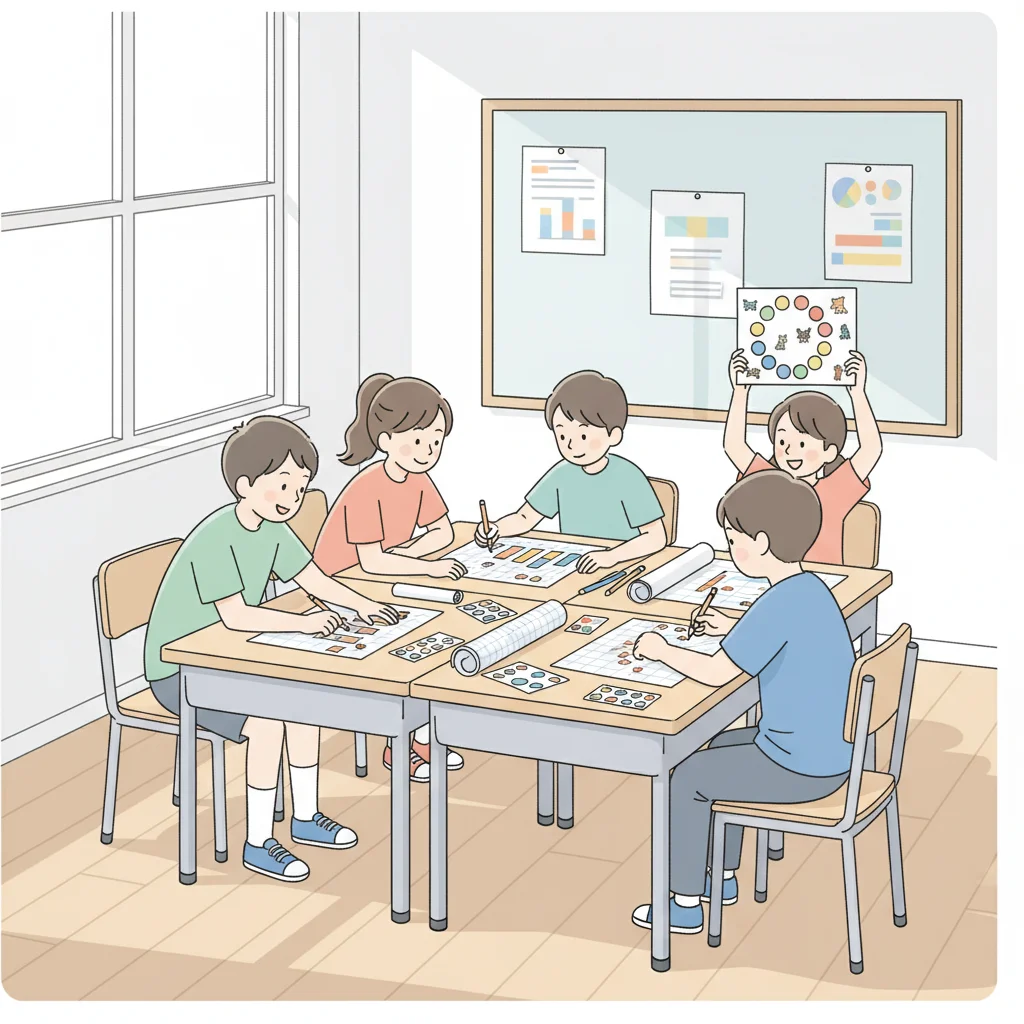
Your Turn to Create!
Choose: Favourite school subject or type of transport to school Collect data from your group Create both a pictogram AND a bar chart Make sure to include labels and titles

What Did We Learn Today?
What is discrete data? How do pictograms help us understand information? When might you use a bar chart instead of a pictogram? What's the most important thing to remember when making charts?