Measuring Reaction Rates
A free science worksheet ready for your classroom. Open in Kuraplan to grab the print-ready PDF, customize it for your students, or generate a fresh version in seconds.

Measuring Reaction Rates
📊 Part 1: Understanding Rate Measurements
Answer: _________________
📈 Part 2: Graph Analysis
Study the data below from a reaction where magnesium ribbon reacts with hydrochloric acid:
Time (min): 0, 1, 2, 3, 4, 5
Gas volume (cm³): 0, 15, 25, 32, 36, 36
Explanation: ________________________________________________
🔬 Part 3: Application and Analysis
Support Notes: Remember that reaction rate depends on how often reactant particles collide with enough energy. Consider what happens to reactant concentration as a reaction progresses.
About This Worksheet
Free in Kuraplan
Sign up free, grab the PDF, and customize it for your class.
Print-Ready
Formatted for standard paper. Clean layout, easy to read.
AI-Generated
Created with Kuraplan's AI, designed for real classroom use.
For Teachers & Parents
Use in classrooms, for homework, tutoring, or homeschool.
Need a custom version of this worksheet?
Kuraplan's AI generates custom worksheets in seconds — differentiated for every learner, aligned to your curriculum.
Generate Custom Worksheets — FreeMore Science Worksheets
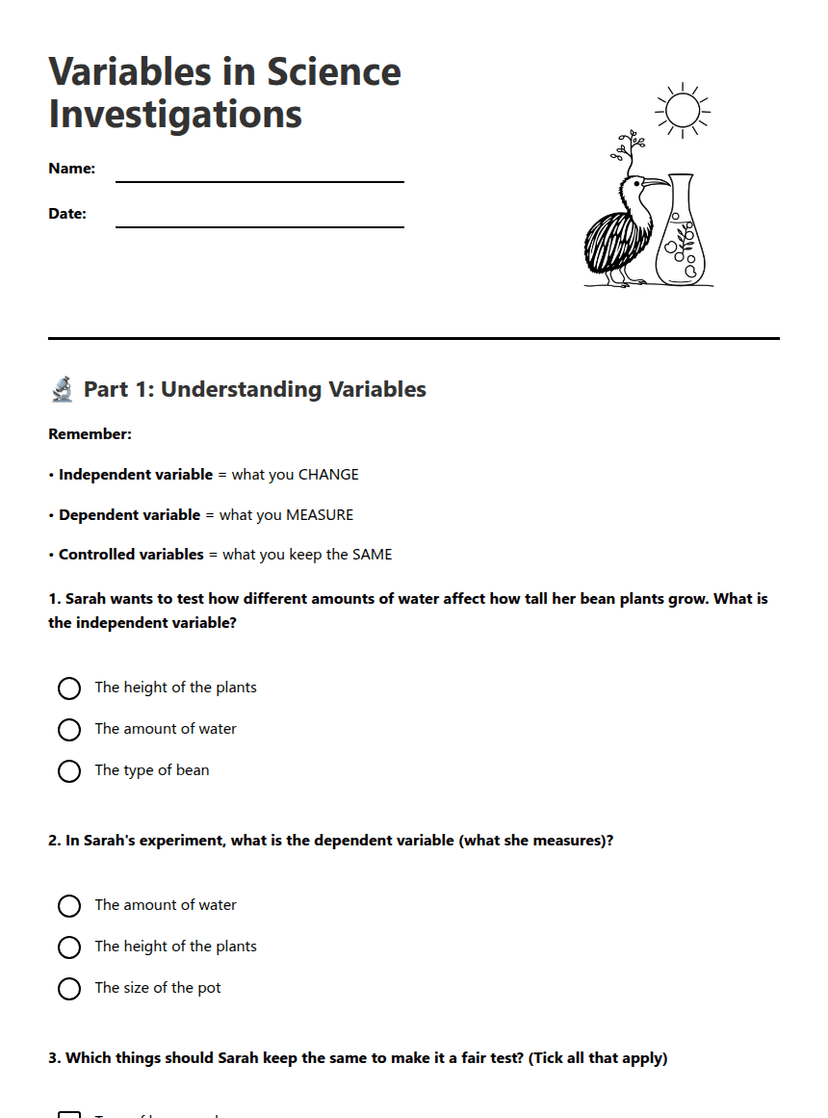
Variables in Science Investigations
Free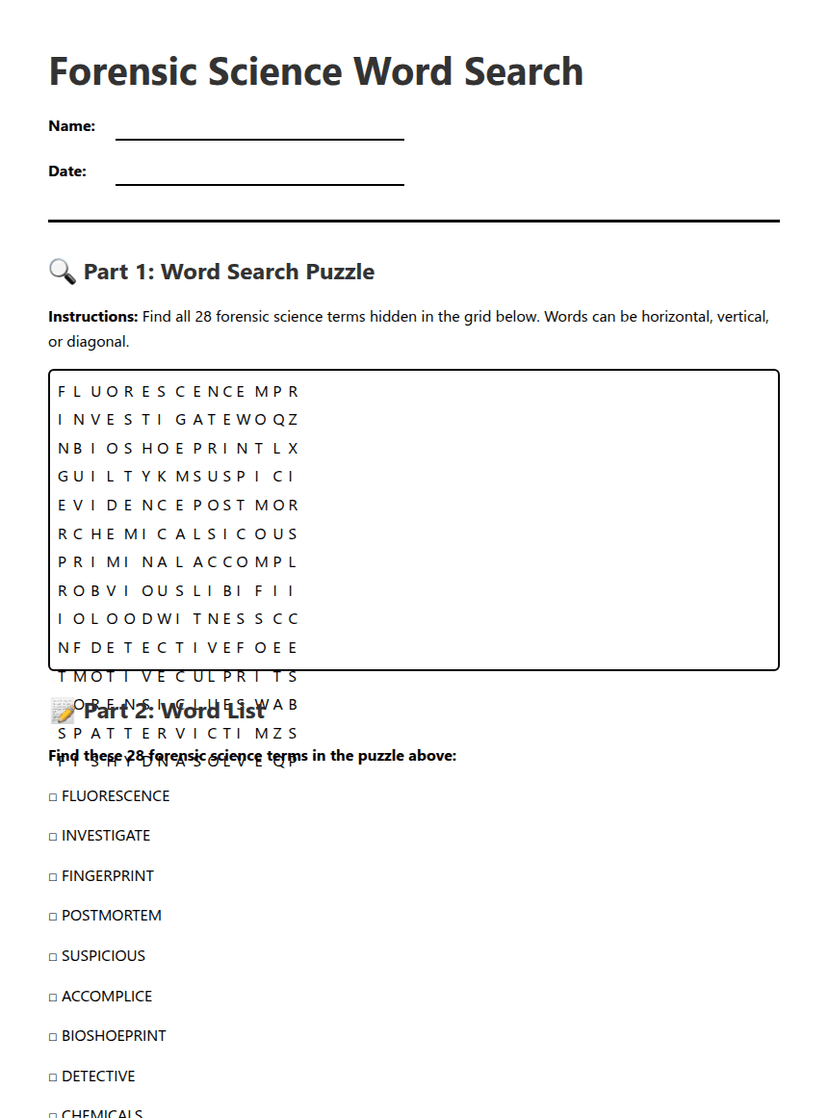
Forensic Science Word Search
Free
Science Observation Recording Sheet
Free
Science Objects Exploration
Free
Sports Science Introduction
Free
Senior Social Science Icebreaker
Free
What is Science?
Free