Pie Chart Template — free printable diagram
Free maths resource for teachers · CC BY-NC 4.0
About this illustration
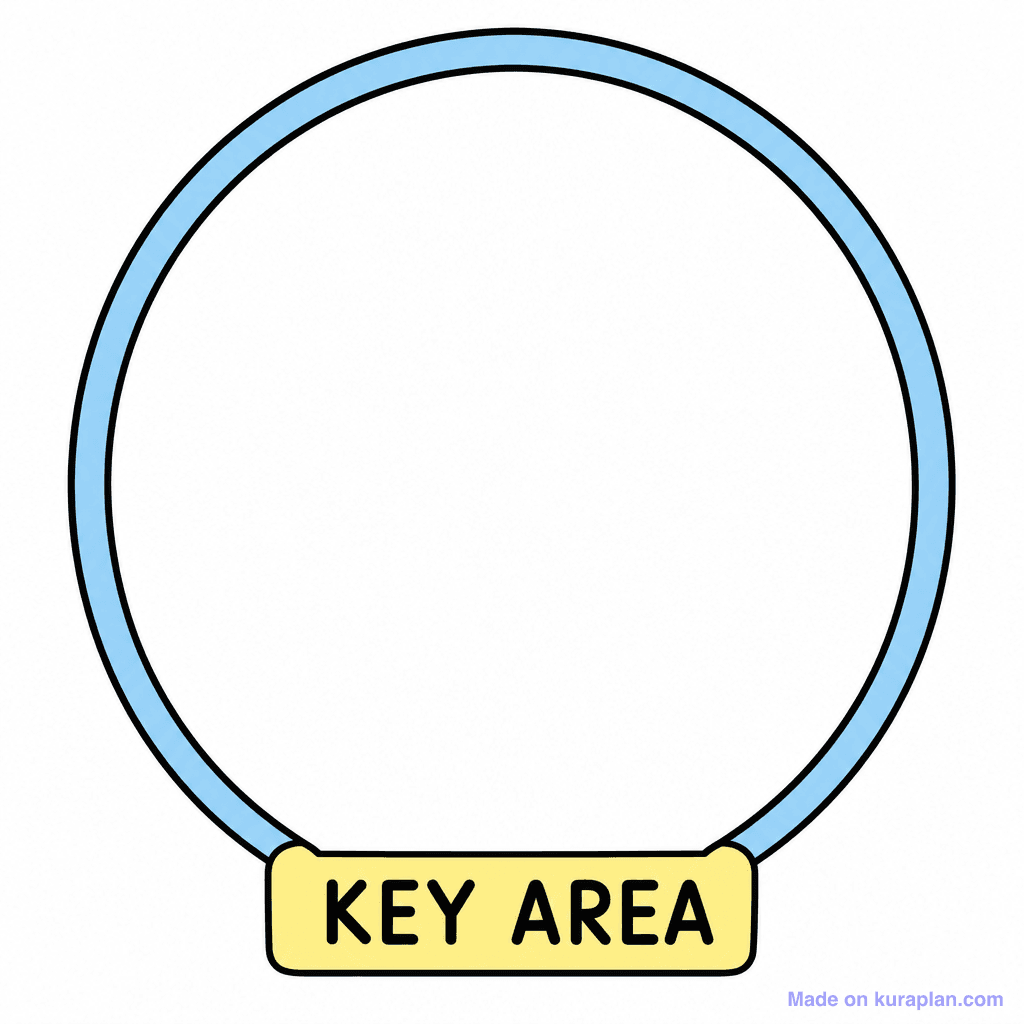
This image depicts a clean, flat illustration of a light blue circle with a bold black outline. Directly below the circle, connected by its outline, is a yellow rectangular label with rounded corners, also outlined in black, containing the text 'KEY AREA' in black capital letters. This graphic serves as a versatile template or graphic organizer element, suitable for drawing attention to critical information or concepts. It can be used across various educational subjects to highlight definitions, important facts, or specific topics within a lesson. Ideal for classroom activities such as worksheets, slide presentations, or labeling exercises where students fill in the content within the 'KEY AREA' circle. The visual style is a simple, high-contrast, decorative flat illustration.
How to use
- 1Right-click the image and choose “Save image as”, or use the download button.
- 2Use it in your classroom worksheets, slides or printables — free under CC BY-NC 4.0.
- 3Attribute as “Image by Kuraplan” or link back to kuraplan.com. Not for commercial resale.
Make worksheets with images like this
Kuraplan's editor has the full image library built in — drag-and-drop into a worksheet in seconds.
Related illustrations
More from Statistics & Probability
Browse by subject
10 subjects · 1,607 free illustrations