ScienceFreePrintable
Data Sense Practice
A free science worksheet ready for your classroom. Open in Kuraplan to grab the print-ready PDF, customize it for your students, or generate a fresh version in seconds.
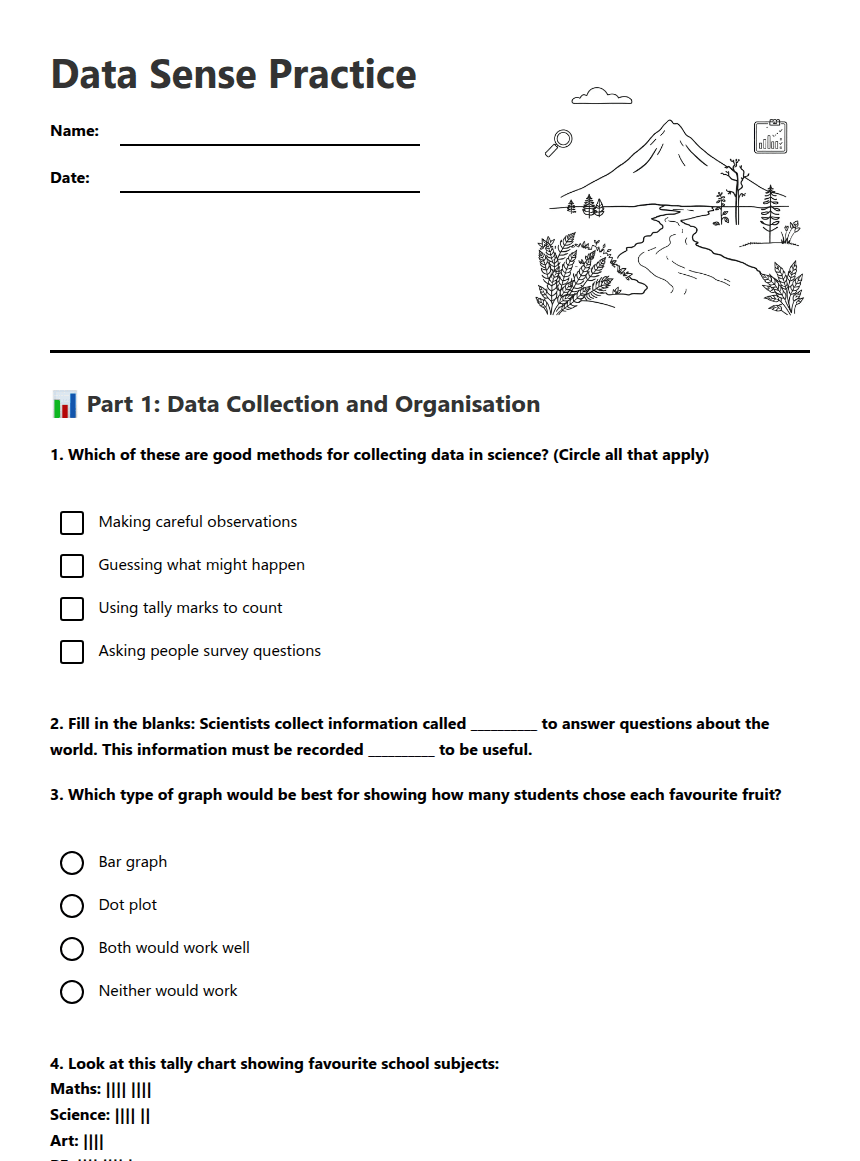
Data Sense Practice
📊 Part 1: Data Collection and Organisation
1. Which of these are good methods for collecting data in science? (Circle all that apply)
Making careful observations
Guessing what might happen
Using tally marks to count
Asking people survey questions
2. Fill in the blanks: Scientists collect information called __________ to answer questions about the world. This information must be recorded __________ to be useful.
3. Which type of graph would be best for showing how many students chose each favourite fruit?
Bar graph
Dot plot
Both would work well
Neither would work
4. Look at this tally chart showing favourite school subjects:
Maths: |||| ||||
Science: |||| ||
Art: ||||
PE: |||| |||| |
Which subject was most popular? ___________
How many students chose Science? ___________
Maths: |||| ||||
Science: |||| ||
Art: ||||
PE: |||| |||| |
Which subject was most popular? ___________
How many students chose Science? ___________
🔍 Part 2: Data Accuracy and Errors
5. Why is it important for scientists to collect data accurately?
6. Sarah counted the number of birds she saw each day for a week. On Tuesday, she forgot to write down 3 birds she saw in the afternoon. What type of problem is this?
Data collection error
Calculation error
Graph error
No problem at all
7. Tom made a bar graph but forgot to label his axes. List two problems this might cause for people reading his graph:
Problem 1: _________________________________________________
Problem 2: _________________________________________________
8. Circle TRUE or FALSE: A graph can sometimes be misleading even if the data is correct.
TRUE
FALSE
📈 Part 3: Reading and Interpreting Data
9. A class collected data about pets owned by students. The bar graph shows:
Dogs: 8 students, Cats: 6 students, Fish: 3 students, Birds: 2 students, No pets: 6 students
Write two sentences describing what this data shows:
Dogs: 8 students, Cats: 6 students, Fish: 3 students, Birds: 2 students, No pets: 6 students
Write two sentences describing what this data shows:
10. If you were collecting data about favourite colours in your class, what steps would you take to make sure your data is accurate?
11. Complete this sentence: When presenting data to others, it is important to be __________ and __________ so people can understand what the information really means.
About This Worksheet
Free in Kuraplan
Sign up free, grab the PDF, and customize it for your class.
Print-Ready
Formatted for standard paper. Clean layout, easy to read.
AI-Generated
Created with Kuraplan's AI, designed for real classroom use.
For Teachers & Parents
Use in classrooms, for homework, tutoring, or homeschool.
Need a custom version of this worksheet?
Kuraplan's AI generates custom worksheets in seconds — differentiated for every learner, aligned to your curriculum.
Generate Custom Worksheets — Free No credit card Curriculum-aligned Under 60 seconds
More Science Worksheets
Year 7–8
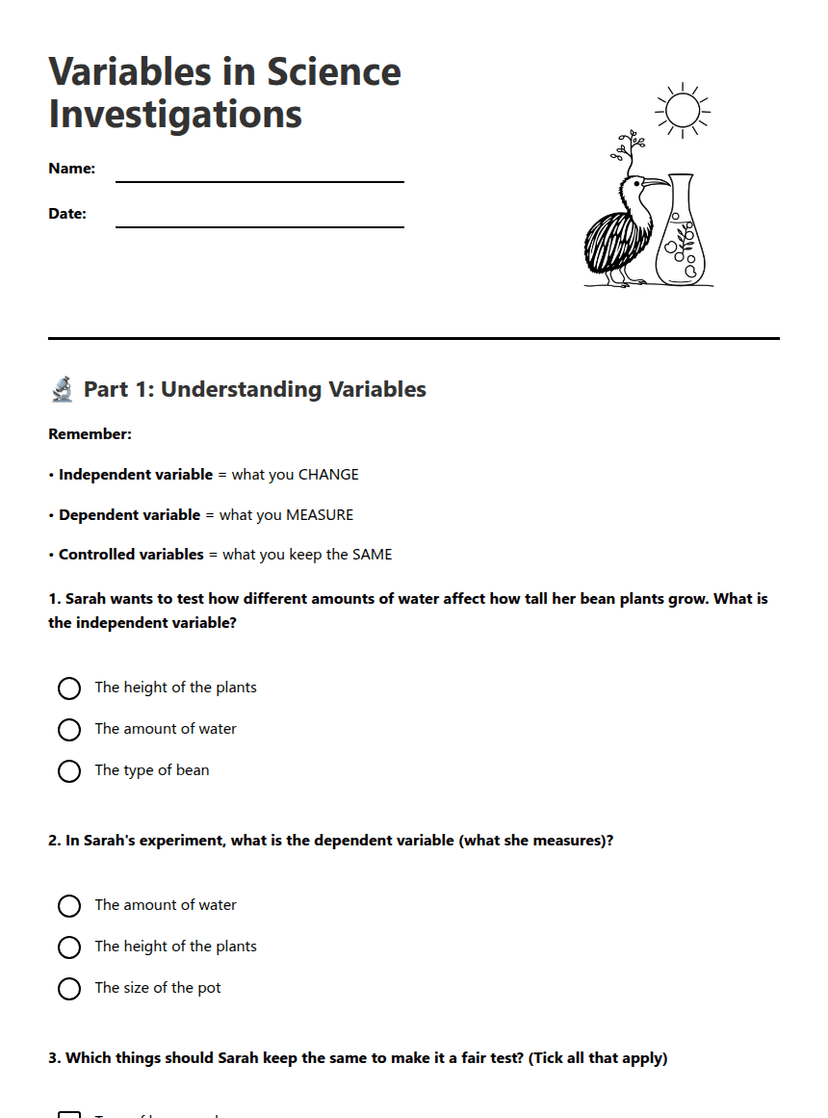
Variables in Science Investigations
Free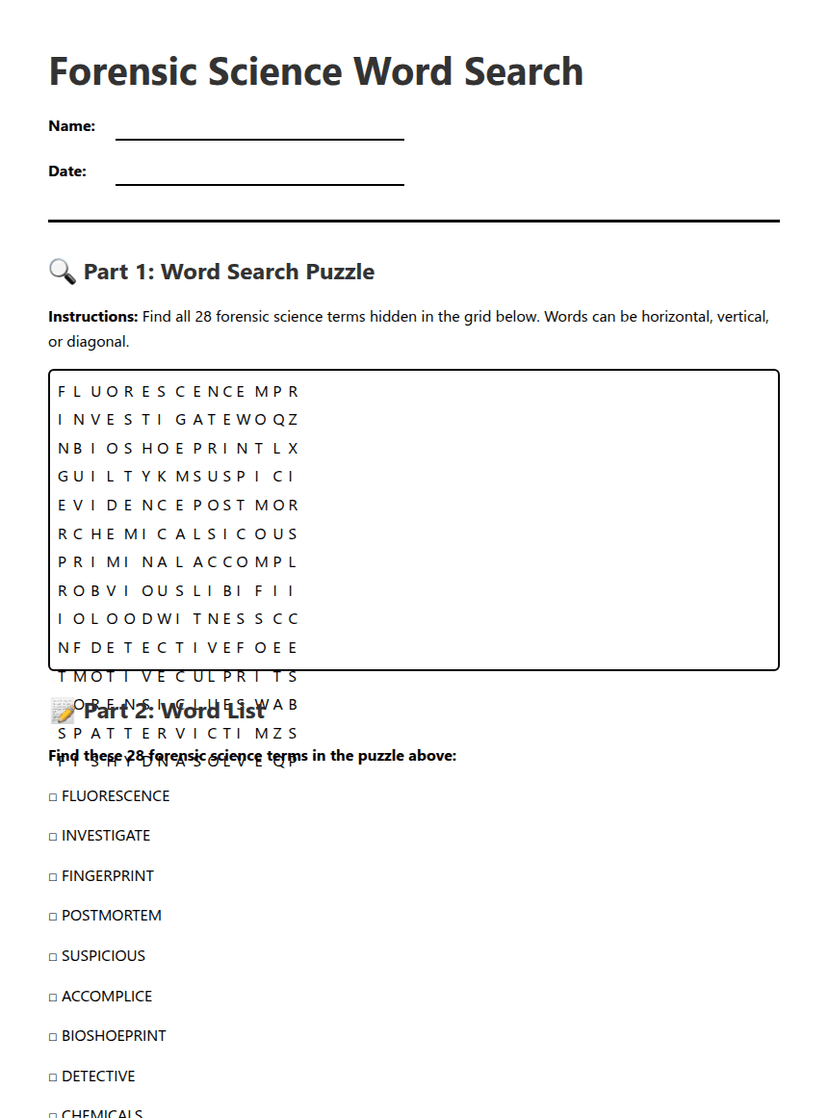
Year 6–7
Forensic Science Word Search
Free
Year 7–8
Science Observation Recording Sheet
Free
Year 7–8
Science Objects Exploration
Free
Year 10
Sports Science Introduction
Free
Year 11–13
Senior Social Science Icebreaker
Free
Year 7–8
What is Science?
Free
Year 5