FreePrintable
Production Possibility Curve Worksheet
A free, printable general worksheet ready for your classroom. Download instantly, print, and hand out to your students — no account needed.
Production Possibility Curve Worksheet
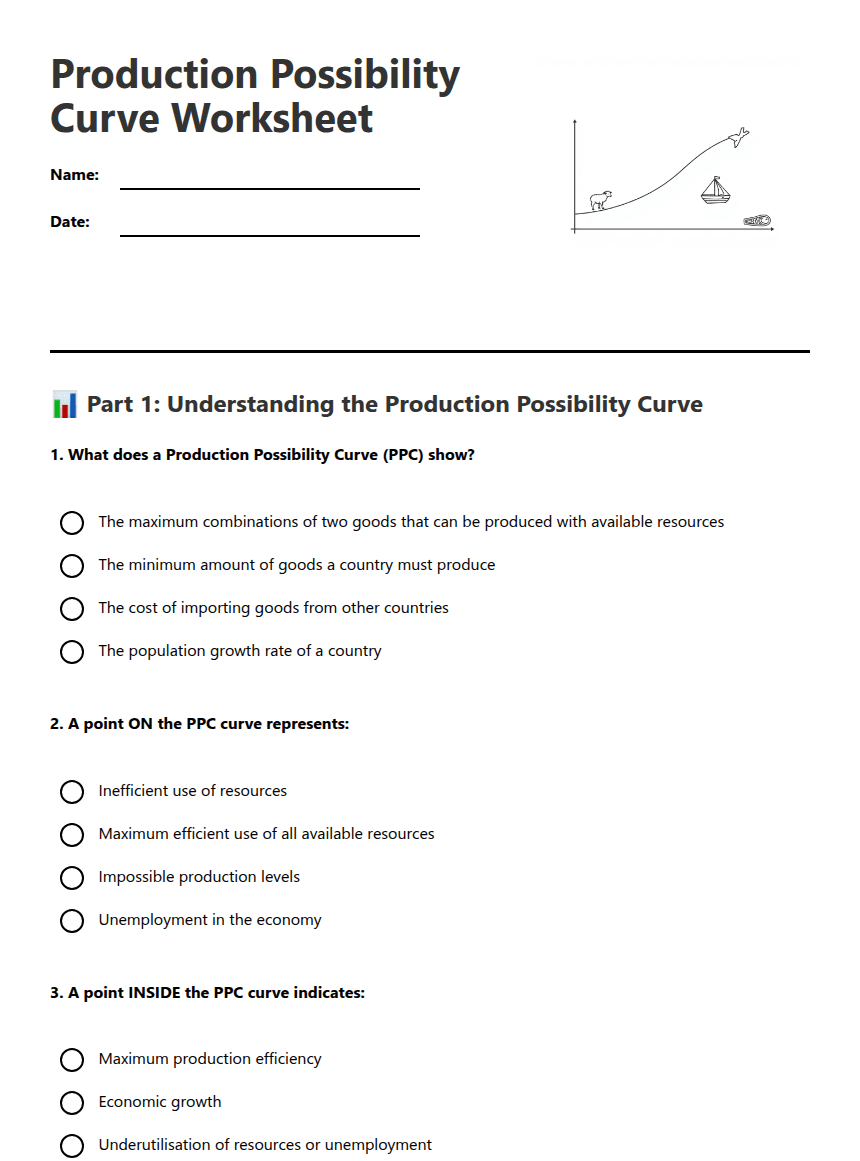
📊 Part 1: Understanding the Production Possibility Curve
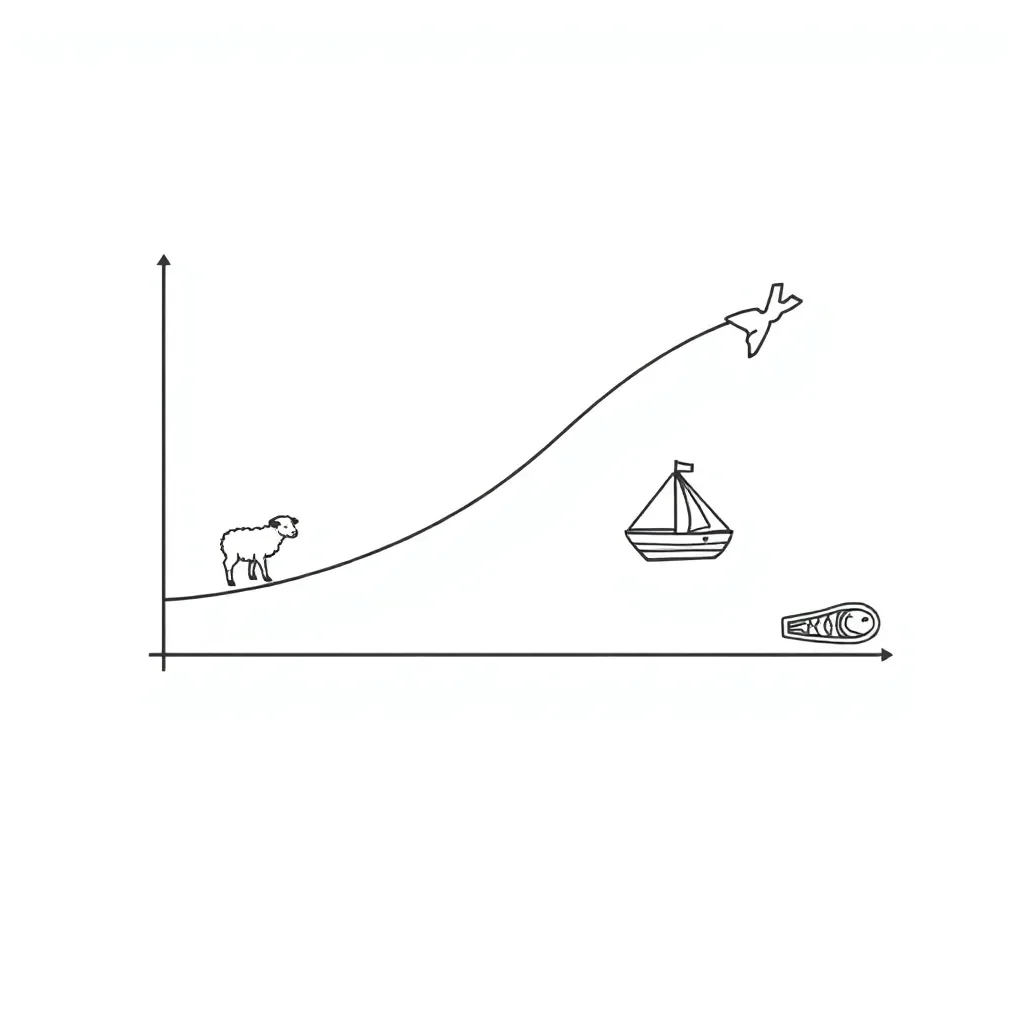
1. What does a Production Possibility Curve (PPC) show?
The maximum combinations of two goods that can be produced with available resources
The minimum amount of goods a country must produce
The cost of importing goods from other countries
The population growth rate of a country
2. A point ON the PPC curve represents:
Inefficient use of resources
Maximum efficient use of all available resources
Impossible production levels
Unemployment in the economy
3. A point INSIDE the PPC curve indicates:
Maximum production efficiency
Economic growth
Underutilisation of resources or unemployment
Technological advancement
4. A point OUTSIDE the PPC curve represents:
Efficient resource allocation
Production levels that are currently impossible with existing resources
Economic recession
Perfect competition
✏️ Part 2: Applying PPC Concepts
5. Imagine New Zealand can produce either cars or computers. If the country is producing at a point inside the PPC, what does this suggest about the economy?
6. Complete the sentence: To move from a point inside the PPC to a point on the PPC, an economy would need to ________________.
7. Explain why a point outside the PPC is considered "impossible" in the short term.
8. What would need to happen for a point that was previously outside the PPC to become achievable?
Economic growth through increased resources
Technological improvements
Better education and training of workers
Increased government spending
🎯 Part 3: PPC Analysis
9. Draw and label a simple PPC curve showing the trade-off between producing wheat and milk in New Zealand. Mark and label one point each: ON the curve (Point A), INSIDE the curve (Point B), and OUTSIDE the curve (Point C).
10. Using your diagram above, explain what each point (A, B, and C) tells us about New Zealand's production efficiency.
About This Worksheet
Free Download
No sign-up, no email, no paywall. Just download and print.
Print-Ready
Formatted for standard paper. Clean layout, easy to read.
AI-Generated
Created with Kuraplan's AI, designed for real classroom use.
For Teachers & Parents
Use in classrooms, for homework, tutoring, or homeschool.
Need a custom version of this worksheet?
Kuraplan's AI generates custom worksheets in seconds — differentiated for every learner, aligned to your curriculum.
Generate Custom Worksheets — Free No credit card Curriculum-aligned Under 60 seconds