MathsFreePrintable

Quadratic Functions Modelling

A free maths worksheet ready for your classroom. Open in Kuraplan to grab the print-ready PDF, customize it for your students, or generate a fresh version in seconds.
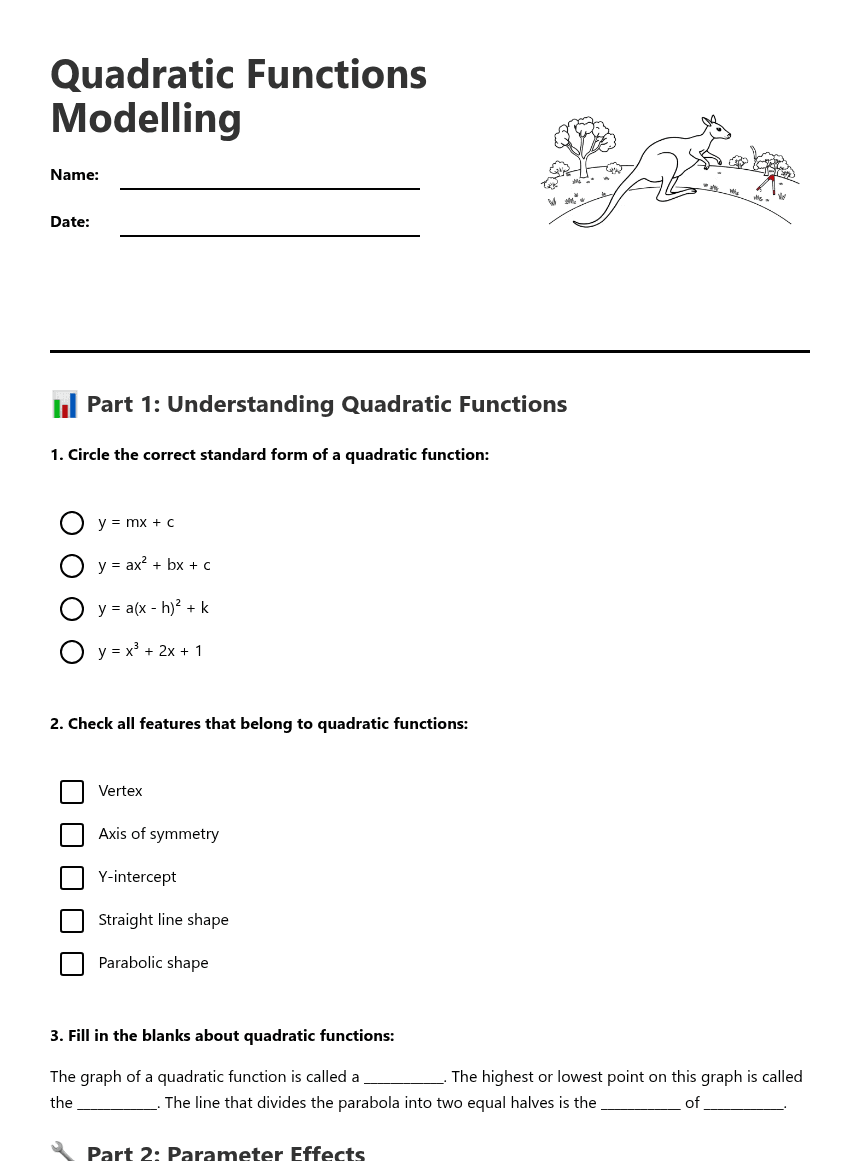
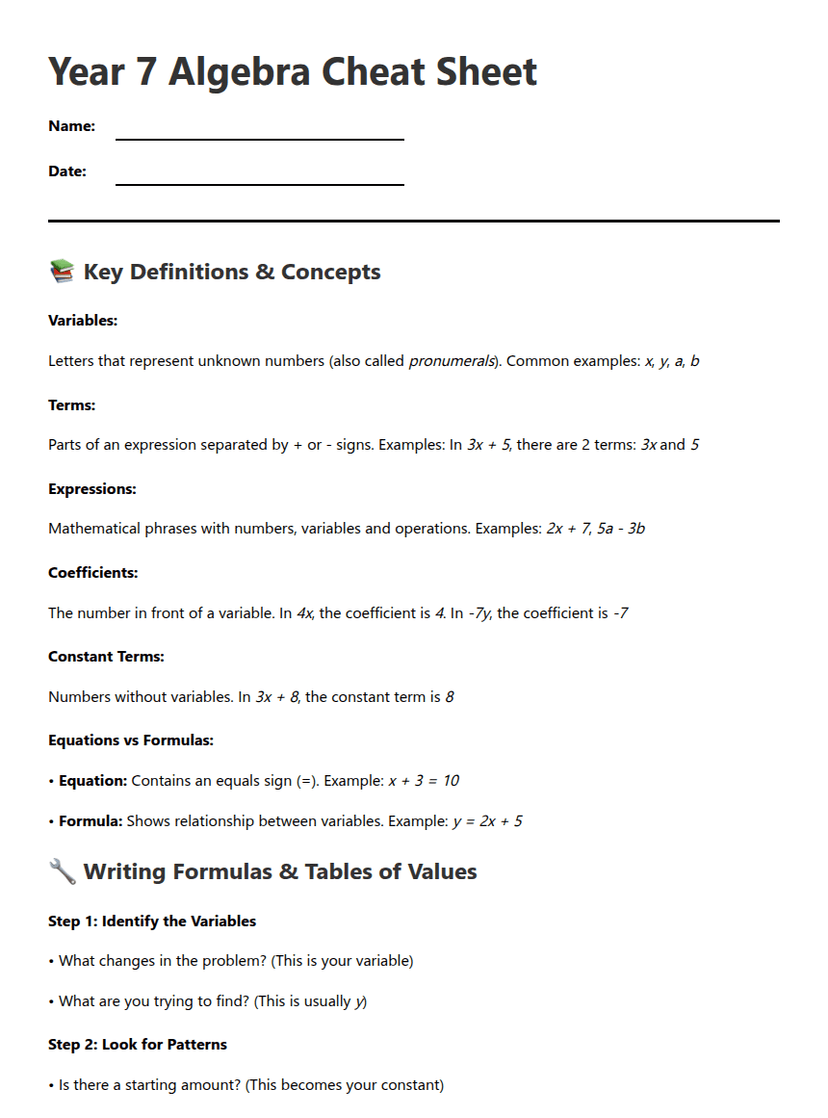
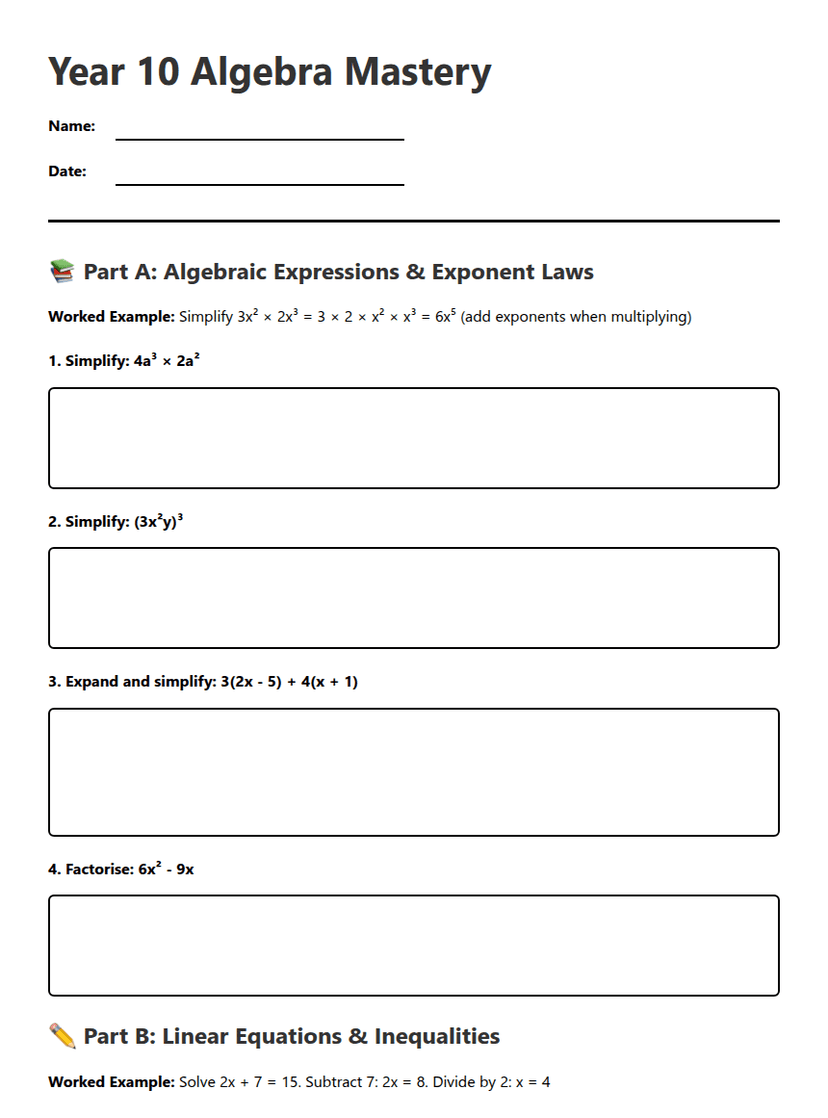
Quadratic Functions Modelling worksheet preview
Quadratic Functions Modelling

Quadratic Functions Modelling

Quadratic function graph illustration

📊 Part 1: Understanding Quadratic Functions

1. Circle the correct standard form of a quadratic function:

y = mx + c

y = ax² + bx + c

y = a(x - h)² + k

y = x³ + 2x + 1

2. Check all features that belong to quadratic functions:

Vertex

Axis of symmetry

Y-intercept

Straight line shape

Parabolic shape

3. Fill in the blanks about quadratic functions:

The graph of a quadratic function is called a ____________. The highest or lowest point on this graph is called the ____________. The line that divides the parabola into two equal halves is the ____________ of ____________.

🔧 Part 2: Parameter Effects

4. For the quadratic function y = ax² + bx + c, describe how each parameter affects the graph:

Parameter 'a':

Parameter 'b':

Parameter 'c':

5. Sketch the graph of y = x² - 4x + 3 and label the vertex and y-intercept:

💰 Part 3: Financial Modelling

6. A small Australian business finds that their daily profit P (in dollars) is modelled by the function P(x) = -2x² + 80x - 600, where x is the number of items sold per day.

a) What is the maximum profit the business can make? Show your working:

b) How many items should be sold to achieve maximum profit?

c) What is the break-even point (when profit = $0)? Show your calculations:

7. Circle the correct interpretation of the coefficient 'a = -2' in the profit function above:

The parabola opens upward, indicating unlimited profit growth

The parabola opens downward, indicating there's a maximum profit point

The business loses $2 for every item sold

The y-intercept is -2

🏃‍♂️ Part 4: Motion and Change Modelling

8. A football is kicked from ground level. Its height h (in metres) above the ground after t seconds is given by h(t) = -5t² + 20t.

a) What is the maximum height reached by the football?

b) At what time does the football reach its maximum height?

c) When does the football hit the ground again?

9. Match each real-world scenario with the most appropriate quadratic model characteristic:
1. Projectile motion
2. Profit maximisation
3. Area optimisation
4. Population growth (limited)
A. Parabola opening downward with maximum point
B. Vertex represents optimal dimensions
C. Height starts and ends at zero
D. Growth reaches a peak then declines

🤔 Part 5: Critical Thinking and Application

10. A farmer wants to create a rectangular paddock using 200 metres of fencing. One side of the paddock will be against an existing fence, so only three sides need fencing.

a) If the width of the paddock is x metres, write an expression for the length:

b) Write a quadratic function for the area A(x) of the paddock:

c) What dimensions will give the maximum area? Show your working:

11. Explain in your own words why quadratic functions are useful for modelling real-world situations involving change:
12. Check all contexts where quadratic modelling might be appropriate:

Calculating simple interest over time

Modelling the path of a thrown boomerang

Optimising revenue for ticket sales

Converting between Celsius and Fahrenheit

Designing the arch of a bridge

Calculating compound interest

About This Worksheet

Free in Kuraplan

Sign up free, grab the PDF, and customize it for your class.

Print-Ready

Formatted for standard paper. Clean layout, easy to read.

AI-Generated

Created with Kuraplan's AI, designed for real classroom use.

For Teachers & Parents

Use in classrooms, for homework, tutoring, or homeschool.

Need a custom version of this worksheet?

Kuraplan's AI generates custom worksheets in seconds — differentiated for every learner, aligned to your curriculum.

Generate Custom Worksheets — Free
No credit card Curriculum-aligned Under 60 seconds