HealthFreePrintable

Understanding Food Labels

A free health worksheet ready for your classroom. Open in Kuraplan to grab the print-ready PDF, customize it for your students, or generate a fresh version in seconds.
Understanding Food Labels worksheet preview
Name:Date:

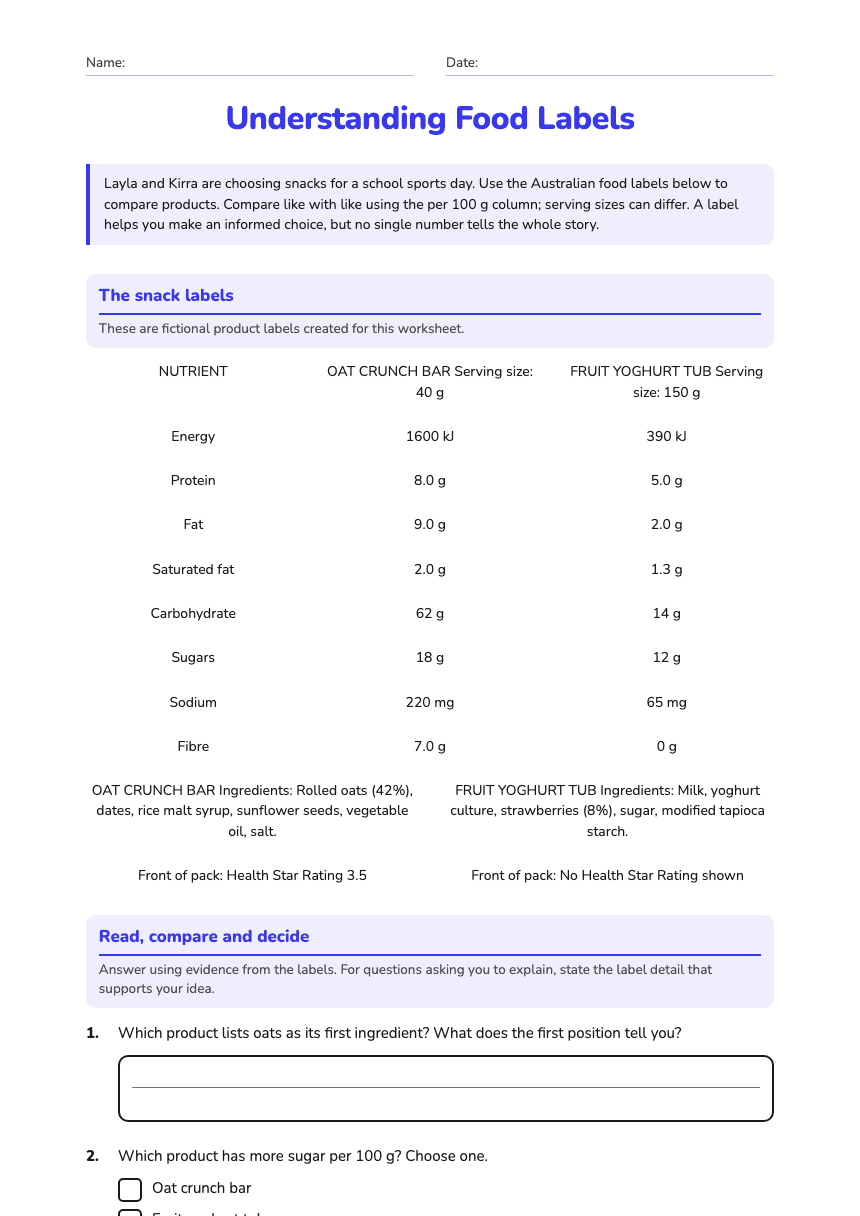
Understanding Food Labels

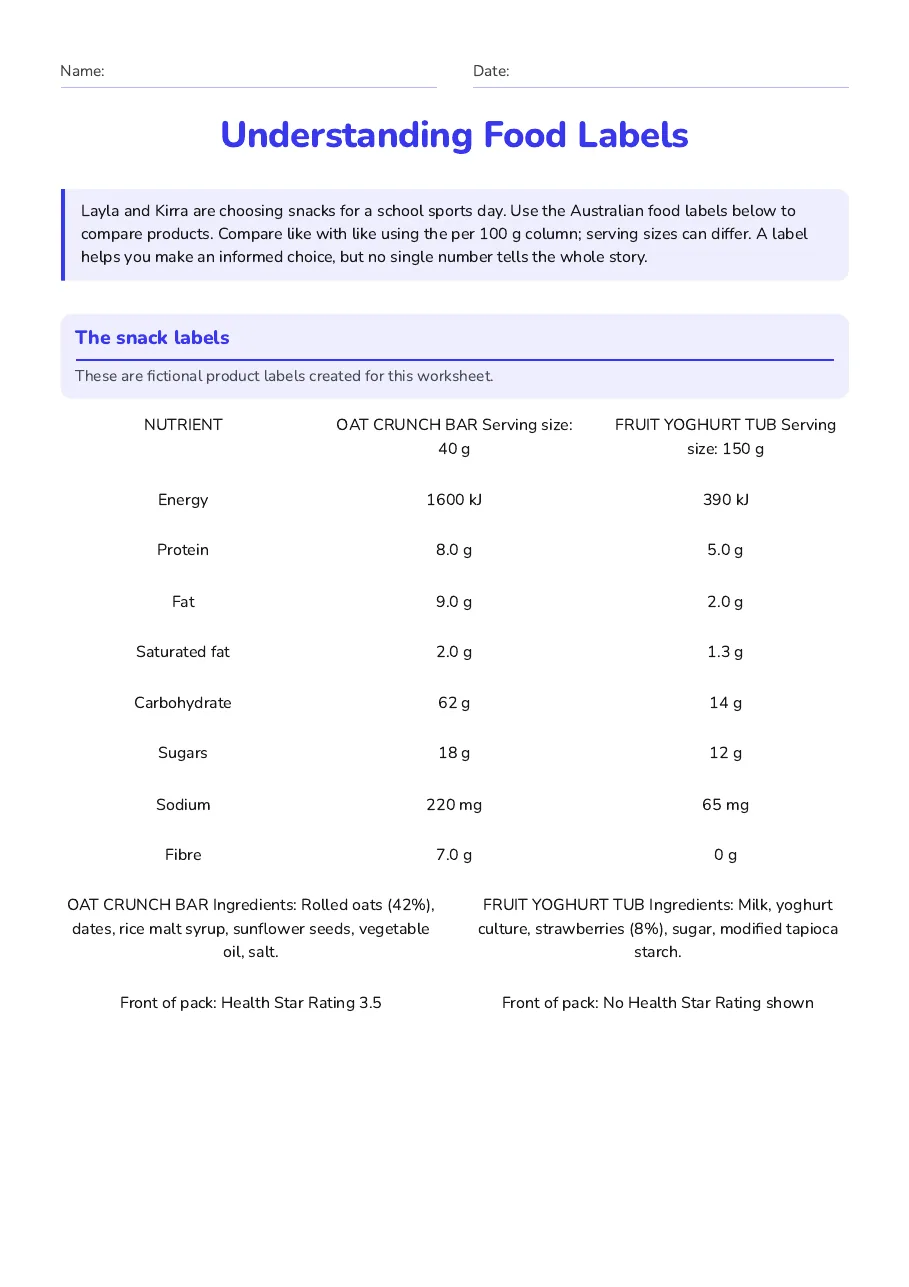
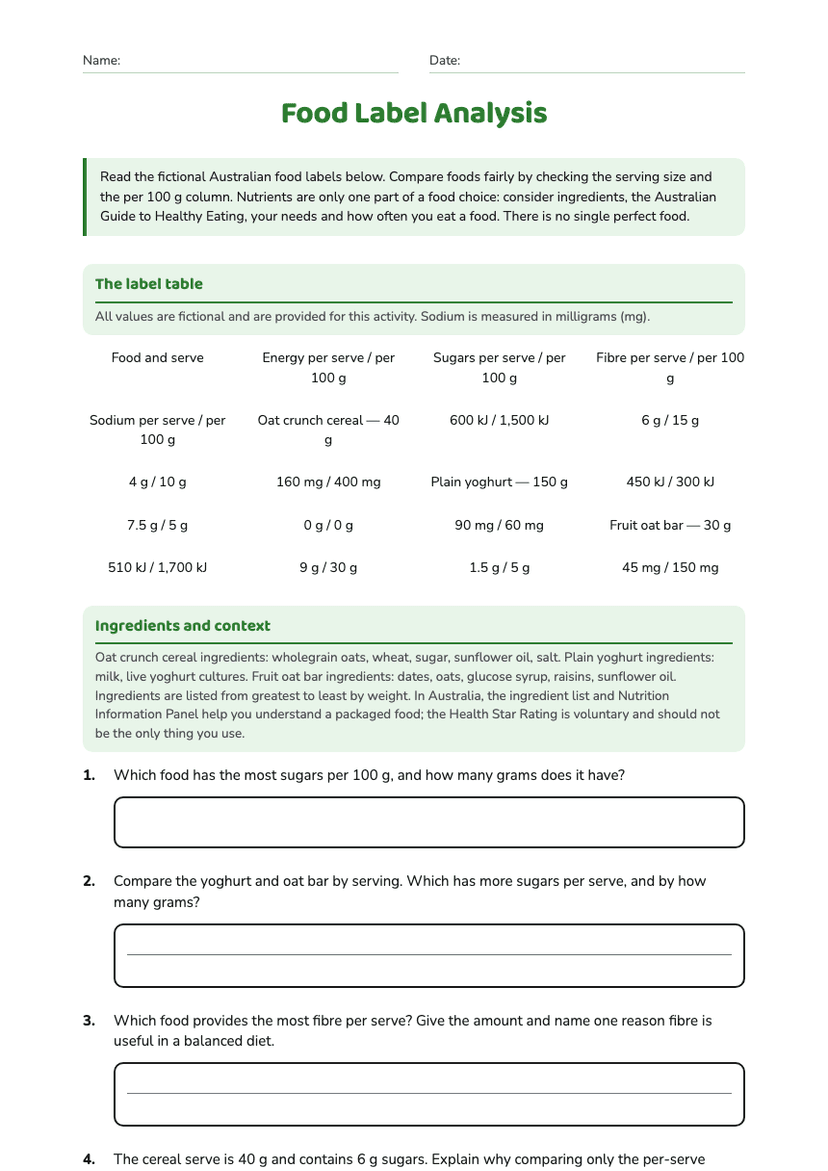
Layla and Kirra are choosing snacks for a school sports day. Use the Australian food labels below to compare products. Compare like with like using the per 100 g column; serving sizes can differ. A label helps you make an informed choice, but no single number tells the whole story.

The snack labels

These are fictional product labels created for this worksheet.

NUTRIENT

OAT CRUNCH BAR Serving size: 40 g

FRUIT YOGHURT TUB Serving size: 150 g

Energy

1600 kJ

390 kJ

Protein

8.0 g

5.0 g

Fat

9.0 g

2.0 g

Saturated fat

2.0 g

1.3 g

Carbohydrate

62 g

14 g

Sugars

18 g

12 g

Sodium

220 mg

65 mg

Fibre

7.0 g

0 g

OAT CRUNCH BAR Ingredients: Rolled oats (42%), dates, rice malt syrup, sunflower seeds, vegetable oil, salt.

FRUIT YOGHURT TUB Ingredients: Milk, yoghurt culture, strawberries (8%), sugar, modified tapioca starch.

Front of pack: Health Star Rating 3.5

Front of pack: No Health Star Rating shown

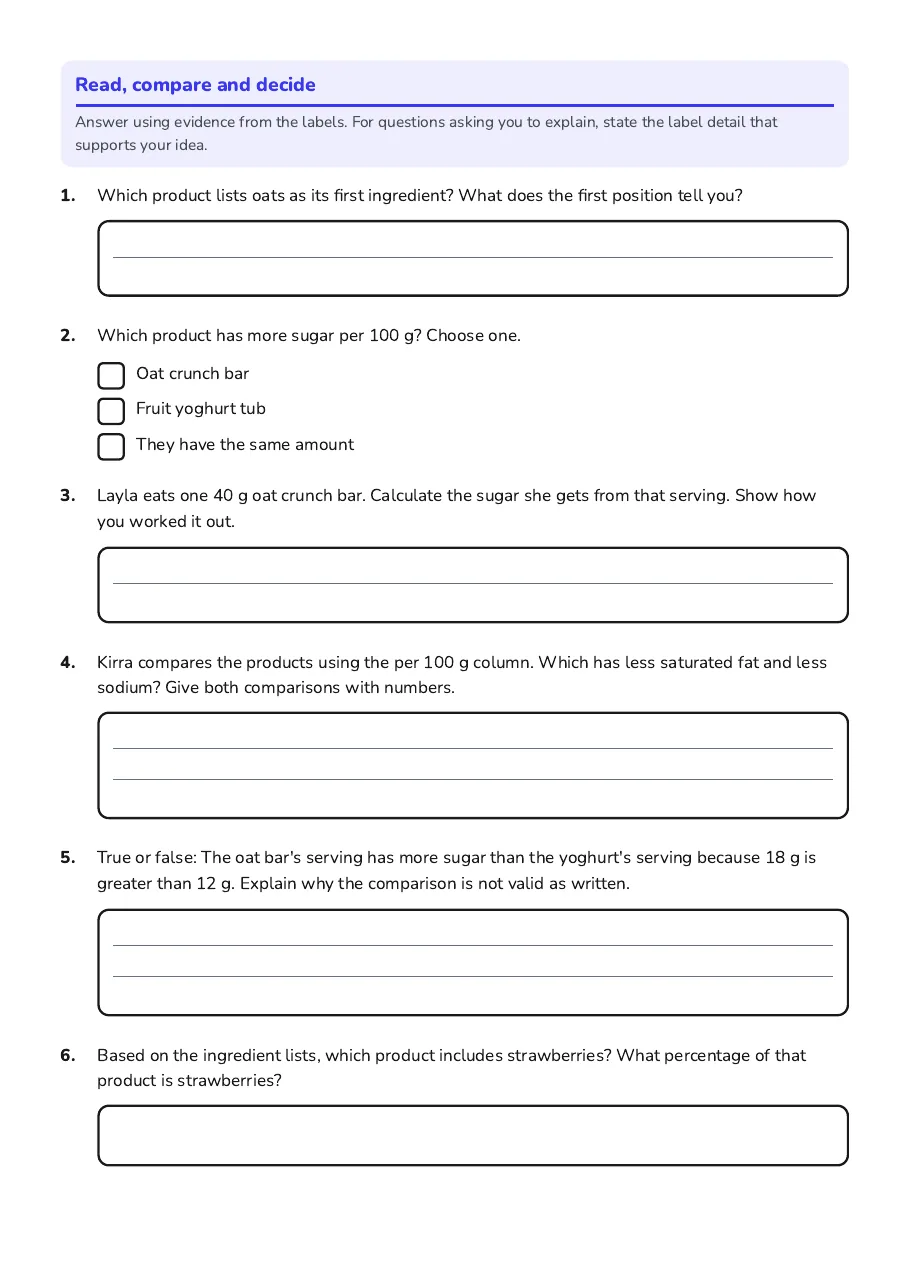
Read, compare and decide

Answer using evidence from the labels. For questions asking you to explain, state the label detail that supports your idea.

1.Which product lists oats as its first ingredient? What does the first position tell you?
2.Which product has more sugar per 100 g? Choose one.
  • Oat crunch bar
  • Fruit yoghurt tub
  • They have the same amount
3.Layla eats one 40 g oat crunch bar. Calculate the sugar she gets from that serving. Show how you worked it out.
4.Kirra compares the products using the per 100 g column. Which has less saturated fat and less sodium? Give both comparisons with numbers.
5.True or false: The oat bar's serving has more sugar than the yoghurt's serving because 18 g is greater than 12 g. Explain why the comparison is not valid as written.
6.Based on the ingredient lists, which product includes strawberries? What percentage of that product is strawberries?
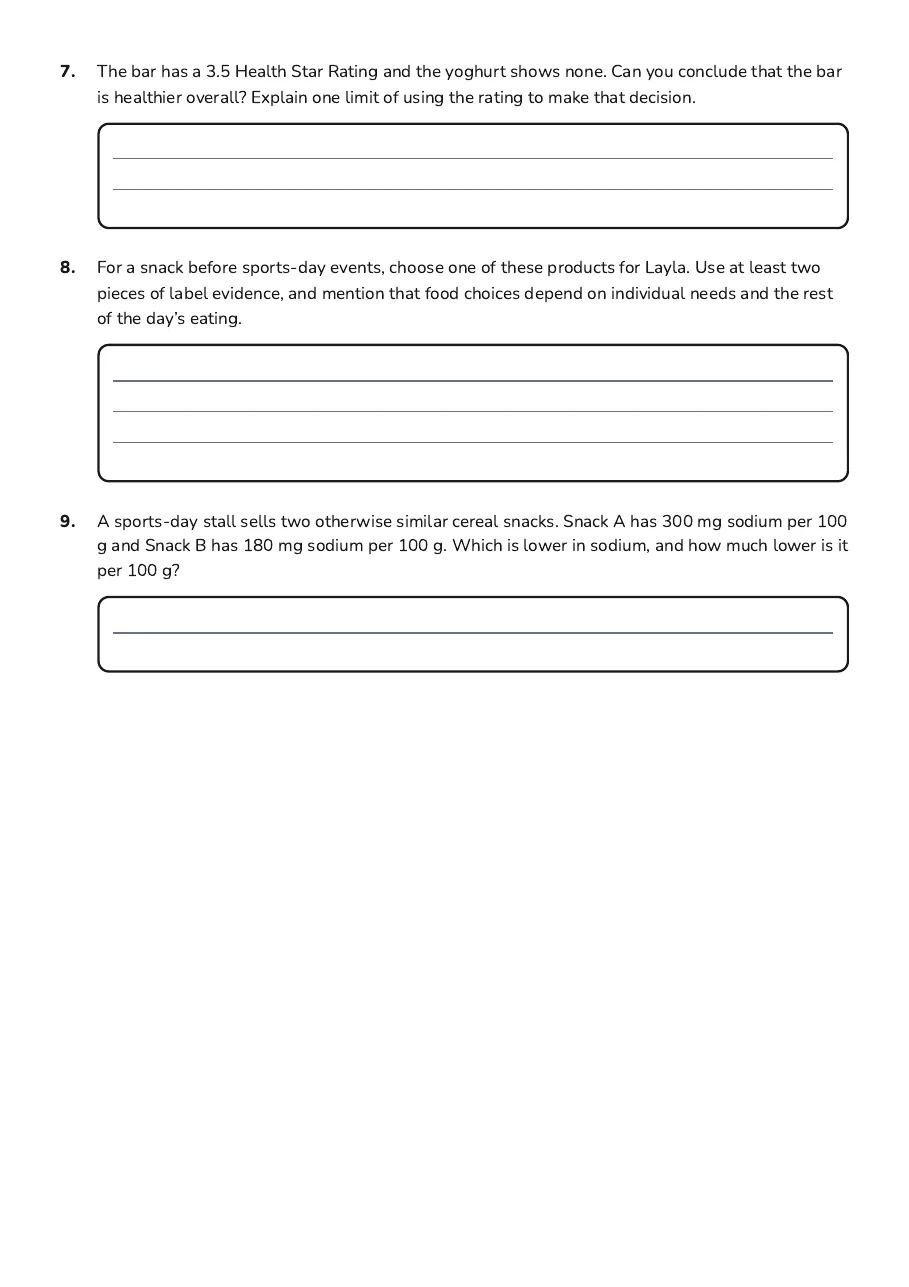
7.The bar has a 3.5 Health Star Rating and the yoghurt shows none. Can you conclude that the bar is healthier overall? Explain one limit of using the rating to make that decision.
8.For a snack before sports-day events, choose one of these products for Layla. Use at least two pieces of label evidence, and mention that food choices depend on individual needs and the rest of the day’s eating.
9.A sports-day stall sells two otherwise similar cereal snacks. Snack A has 300 mg sodium per 100 g and Snack B has 180 mg sodium per 100 g. Which is lower in sodium, and how much lower is it per 100 g?

3 printable pages

  • Understanding Food Labels, page 1 of 3: The snack labels

    Page 1

  • Understanding Food Labels, page 2 of 3: Read, compare and decide

    Page 2

  • Understanding Food Labels, page 3 of 3: 7. The bar has a 3.5 Health Star Rating and the yoghurt shows none. Can you conclude that…

    Page 3

About This Worksheet

Free in Kuraplan

Sign up free, grab the PDF, and customize it for your class.

Print-Ready

Formatted for standard paper. Clean layout, easy to read.

AI-Generated

Created with Kuraplan's AI, designed for real classroom use.

For Teachers & Parents

Use in classrooms, for homework, tutoring, or homeschool.

Need a custom version of this worksheet?

Kuraplan's AI generates custom worksheets in seconds — differentiated for every learner, aligned to your curriculum.

Generate Custom Worksheets — Free
No credit card Curriculum-aligned Under 60 seconds