You've probably seen this lesson go sideways. Students can follow a worked example for finding a percent, they can even copy the steps, and then a word problem lands in front of them and everything falls apart. They mix up the whole and the part, treat the percent sign like decoration, or reach for a decimal trick they don't understand.
That's usually not a practice problem. It's a foundation problem. If you want to know how to teach percentages so students can use them beyond one worksheet, the fix isn't more speed drills. It's better sequencing, stronger visuals, and repeated work connecting percentages to fractions, decimals, and real situations.
Why Percentages Are So Tricky and How to Fix It
Percentages sit at an awkward intersection in math. They're part fraction, part ratio, part decimal, and part language puzzle. A student may know that 25% is “something with 25,” but still not know whether that means divide by 25, subtract 25, or write 0.25. That confusion shows up fast when the numbers stop being friendly.
The urgency is real. Only 32% of American students achieve proficiency in math by fourth grade, and that drops to 22% by twelfth grade, according to Everway's summary of math explicit instruction. Percentages aren't the only reason for that gap, but they're one of the clearest examples of what happens when students are taught procedures before meaning.
What usually doesn't stick
A lot of percentage instruction starts with shortcuts:
- move the decimal
- turn the percent into a decimal
- multiply
- memorize sale problems
Students can sometimes perform those steps, but they don't build a mental model. When the question changes form, their confidence disappears.
Practical rule: If students can calculate a percent but can't explain what the percent represents, they're not ready to rely on a formula alone.
What works better
Percentages become teachable when students see them as relationships, not tricks. That means:
- Naming the whole first: Students need to know 100% of what.
- Linking representations: Percent, fraction, decimal, picture, and context should point to the same idea.
- Using explicit modeling: Teachers show the reasoning out loud, not just the answer path.
- Returning to anchor values: Familiar percents give students something stable to think with.
When I'm coaching teachers, I usually suggest planning percentage lessons the same way we plan fraction lessons. Start concrete, stay visual longer than feels necessary, and only move abstract when students can explain the model. If you need quick practice materials that keep fractions and percents connected, these fractions and percentages practice materials from Kuraplan fit that approach well.
Laying the Foundation with the Per Centum Concept
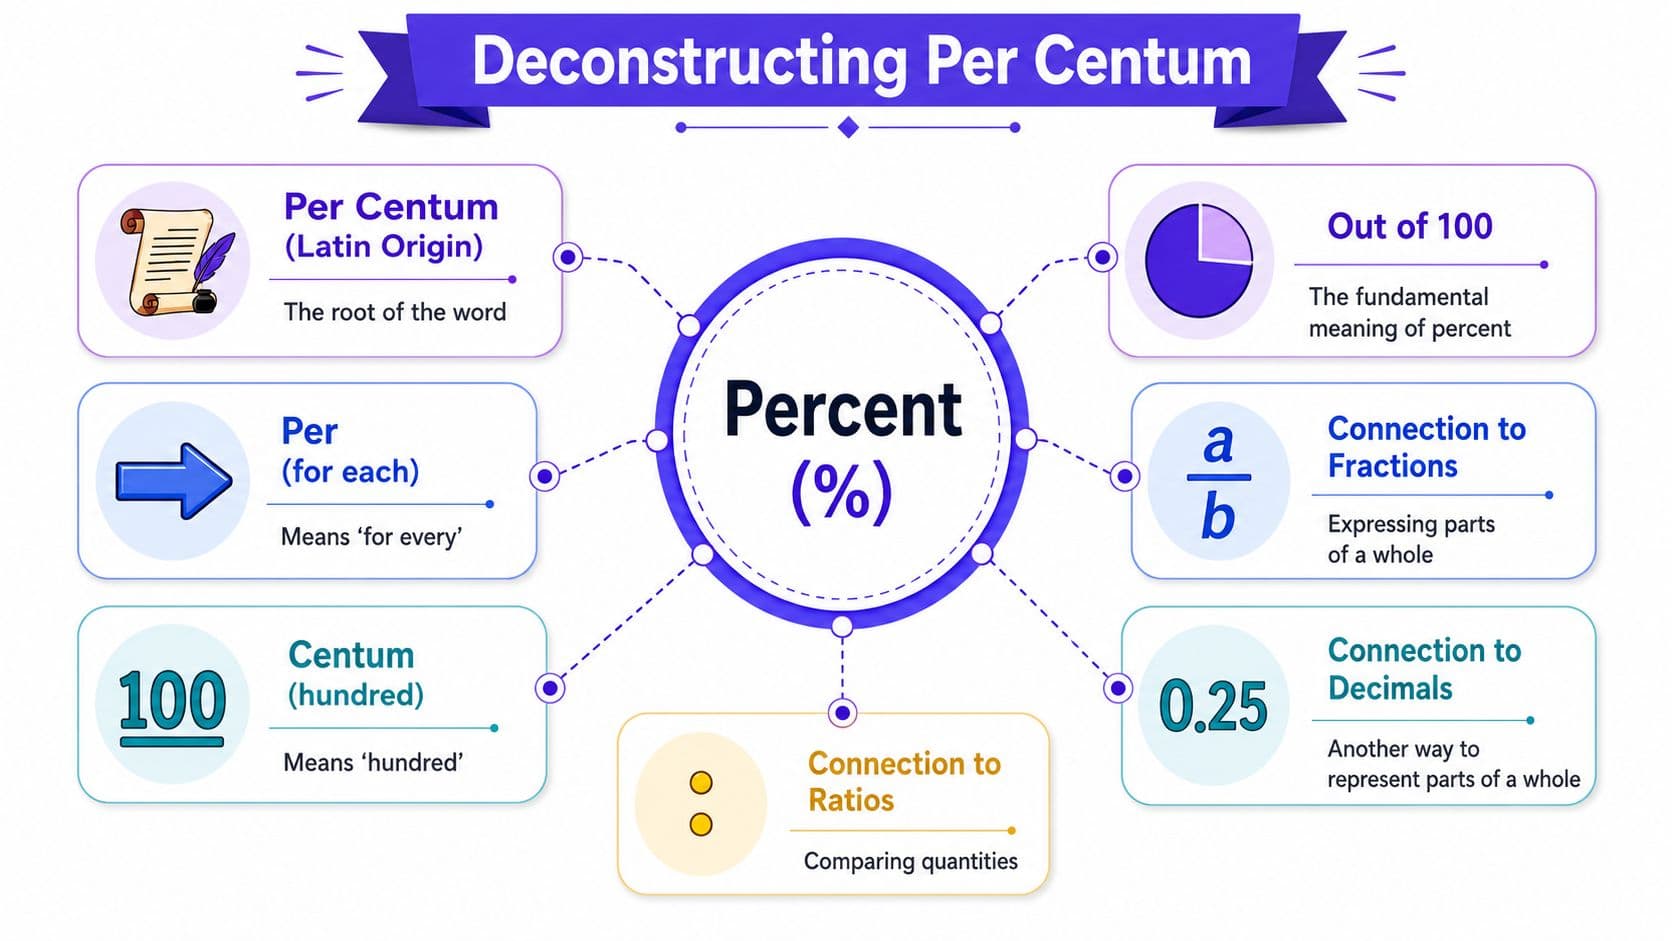
Before students calculate anything, they need to know what the word means. Percent is not just a symbol attached to a number. It comes from the Latin per centum, meaning by the hundred, and the symbol evolved between the 15th and 17th centuries from earlier forms such as p 100 or p cento, as explained in this percentage history guide.
Start with language, not rules
I like students to hear this sentence early and often: a percentage is a fraction out of 100.
That single idea prevents a lot of later confusion. It helps students see that:
- 50% means 50 out of 100
- 25% means 25 out of 100
- 10% means 10 out of 100
From there, students can connect those to familiar fraction ideas without treating percent as a separate topic with separate rules.
Classroom moves that make the idea visible
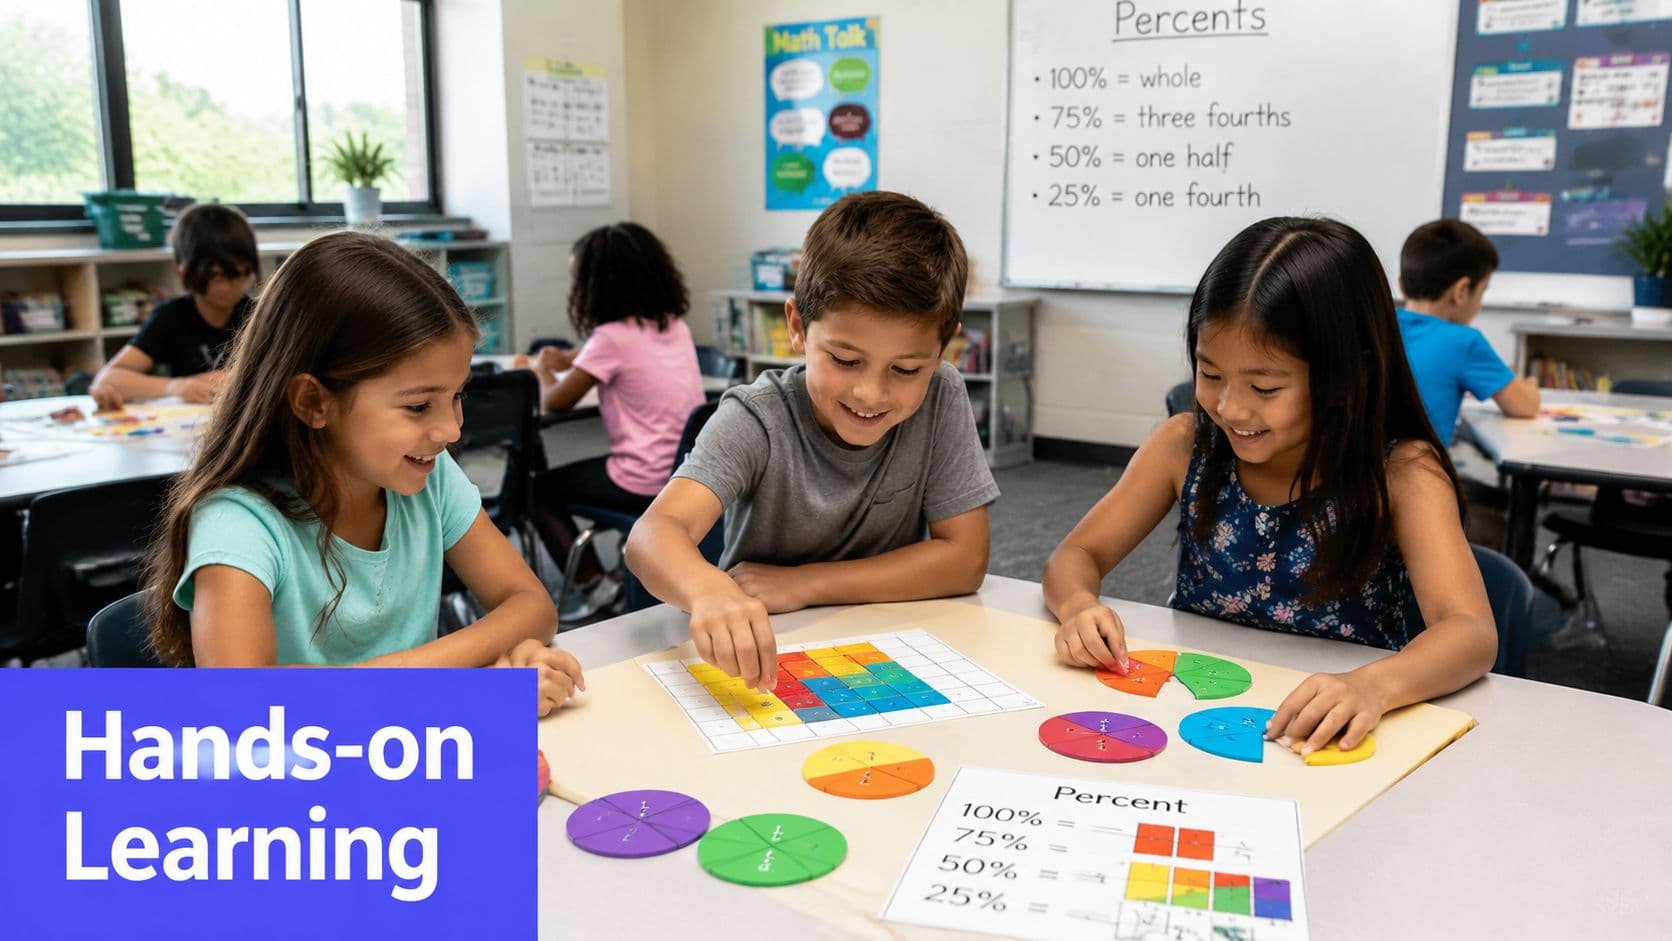
Hundred-based visuals are particularly useful. Good options include:
- Hundred grids: Shade parts of the grid so students can see “out of 100.”
- Base-ten blocks: Use a flat as the whole and smaller pieces as parts of that whole.
- Real classroom tallies: Attendance, reading completion, survey responses, or anything else that can be framed as part of a set.
A hundred grid is especially useful in upper elementary and middle grades because it keeps the denominator visible. Students don't have to guess what the whole is. They can see it.
If students don't understand why percent means “out of 100,” every later conversion feels arbitrary.
Keep the conceptual language consistent
One common mistake is rushing into “just move the decimal.” That shortcut often hides the central idea students need. A better script sounds like this:
- Name the whole
- State the part out of 100
- Connect it to a fraction
- Then connect it to a decimal
That order matters. It keeps the percent rooted in meaning.
For younger students, this may stay mostly visual and oral. For older students, especially in middle and high school, the same idea still matters. They just need it expressed more efficiently. Even algebra students who can manipulate symbols often benefit from hearing percent described again as “part per hundred.” It grounds later work with tax, interest, data displays, and percent change.
A Step-by-Step Guide Using the CPA Approach
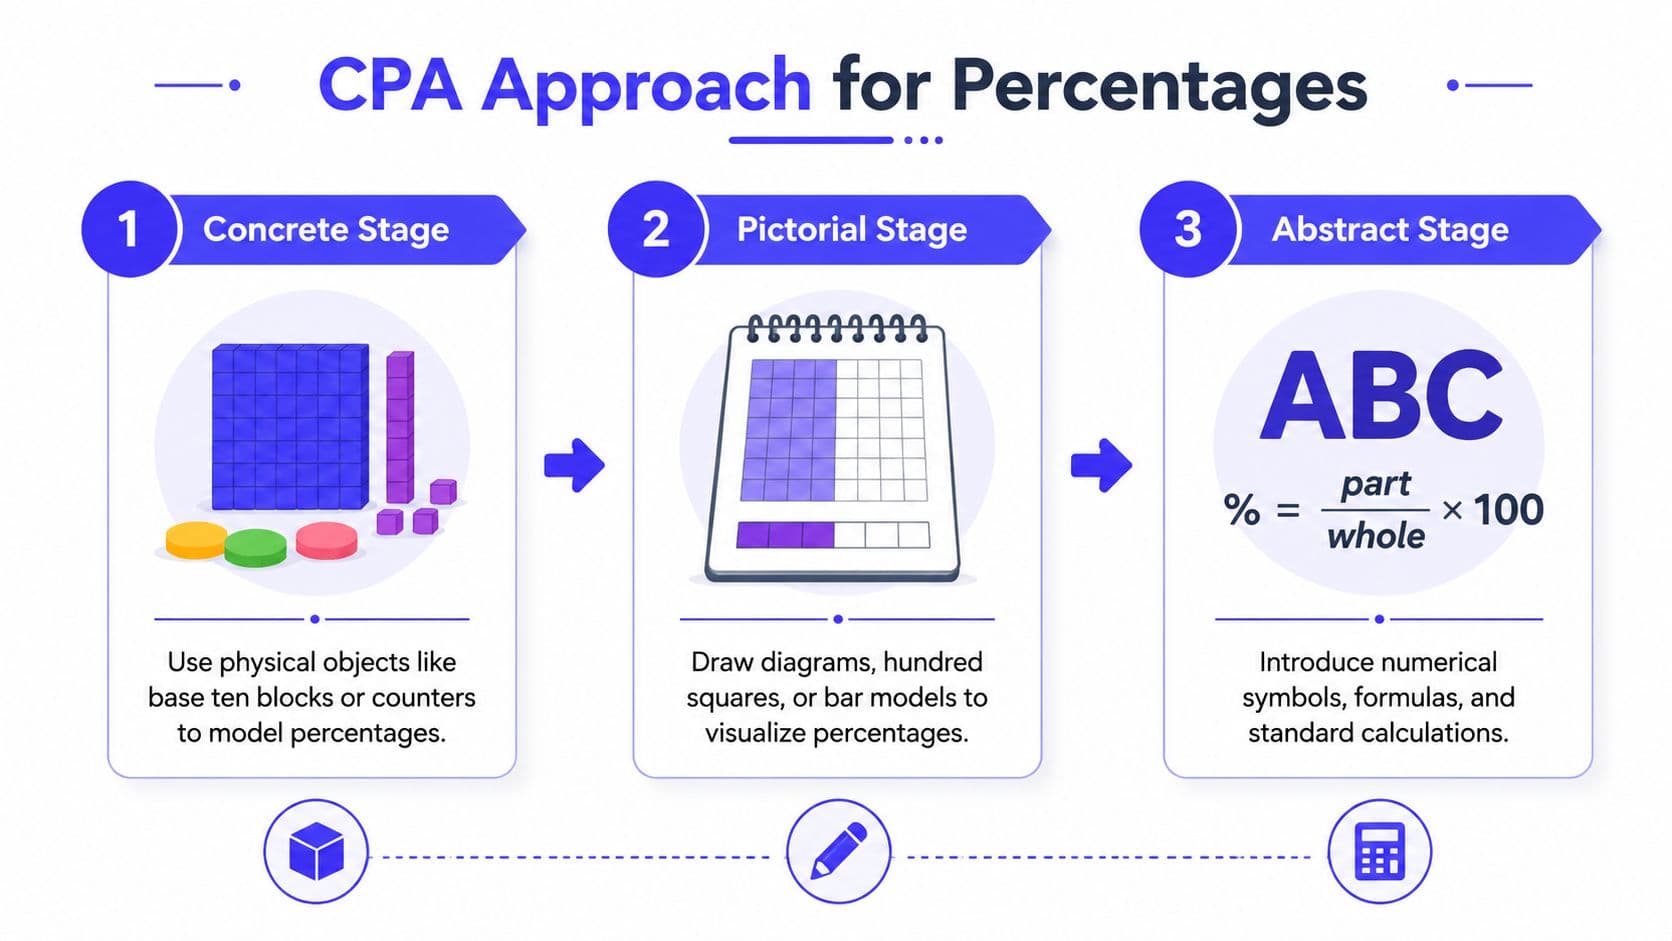
The most reliable way I've seen teachers build durable understanding is the CPA approach: concrete, pictorial, abstract. It slows down the lesson at the start, but it speeds up understanding later because students aren't memorizing disconnected procedures.
Concrete stage
At the concrete stage, students physically build the whole and the part.
In elementary grades, that might mean a set of 100 counters or a ten-by-ten mat with cubes. In middle grades, it can still be helpful to use base-ten blocks or paper strips divided into equal parts. The point isn't that manipulatives are childish. The point is that they make the whole visible.
Try this sequence:
- Build 100 as the whole
- Select a part, such as 25 pieces
- Describe it three ways: 25 out of 100, 25%, and a related fraction or decimal if students are ready
- Compare parts like 10%, 50%, and 75% using the same whole
Students need time here. If they can't describe what they built, don't move on yet.
Pictorial stage
Once students can model percentages with objects, shift to drawings. At this point, bar models become especially useful. Make Sense of Math explains a strong process: define the whole bar, divide it into sections based on the percentage, calculate the value per section, and then sum the shaded sections to find the part.
For example, if students are finding 20% of a quantity:
- draw one bar for the whole
- split it into fifths, because 20% is one fifth of 100%
- determine the value of each section
- shade the needed part
This works because students can see structure. They're not just punching numbers through a rule.
Why bar models help
Bar models are especially powerful when students confuse:
- the part
- the whole
- the percent
A visual model forces each of those to have a place.
Coaching move: Ask, “Where is the whole in your model?” before you ask for a calculation.
That one question catches a lot of mistakes early.
Abstract stage
Only after students can explain the concrete and pictorial models should you formalize the numerical method. At this point, the formula isn't a trick. It's shorthand for an idea they already understand.
Students can generalize the process as:
- multiply the quantity by the percent value
- divide by 100
But keep the model close at hand. If a student gets lost, send them back to the bar, strip diagram, or hundred representation.
This is also the stage where lesson planning matters. If you're mapping the progression from manipulatives to visuals to equations, this lesson planning guide from Kuraplan is useful for organizing the sequence and deciding where to build in checks for understanding.
What the progression looks like across grade bands
| Grade band | Concrete | Pictorial | Abstract |
|---|---|---|---|
| Elementary | counters, hundred grids | shaded grids, tape diagrams | simple percent statements |
| Middle school | strips, base-ten blocks | bar models, ratio tables | equations and multi-step problems |
| High school | quick reference to models | schematic bar or area sketches | algebraic percent problems |
The grade level changes. The progression doesn't.
Engaging Percentage Activities for Your Classroom
Once students have a sound model of percent, the most productive activities are the ones that make them decide what the percent means in context. That's where understanding gets tested.
Classroom store and discount sorting
A classroom store works because students care about the decision. Set up simple price cards and ask students to determine sale prices, compare discounts, or identify which deal is better. The strongest version of this task isn't just “find the answer.” It's “justify your choice.”
You'll hear useful student thinking quickly:
- some rely on benchmark percents
- some use fractions
- some multiply immediately
- some still think the larger percent always means the better deal without attending to the whole
That gives you excellent formative information.
Sports, surveys, and class data
Another reliable activity is using percentages with class-generated data. Sports stats, reading trackers, survey results, attendance patterns, or poll data all work because students can discuss whether a percentage is reasonable.
Ask students to:
- estimate before calculating
- represent the data visually
- explain what the percentage says about the situation
The conversation matters as much as the arithmetic. If a result doesn't make sense in context, students need to say so.
English-to-math translation for word problems
Word problems are where many students freeze, even after they understand the arithmetic. One practical routine that helps is the explicit English-to-Math translation protocol described in these percentage teaching tips: “What” becomes the unknown variable, “is” becomes the equal sign, and “of” becomes multiplication.
For a problem like “36% of what number is 54?” students can translate phrase by phrase instead of guessing the equation structure.
I teach this as a language routine:
- What = the unknown
- Is = equals
- Of = multiply
That doesn't solve every problem automatically, but it gives students an entry point.
Write the sentence first. Translate second. Solve third. Students who skip the translation step usually lose track of the whole.
Movement and discussion tasks
Percentages also lend themselves well to station work. Post different problem types around the room:
- percent of a number
- finding the whole from a part
- comparing two discounts
- deciding whether an answer is reasonable
This kind of rotation keeps the topic from becoming a page of repetitive exercises. If you want an extra discussion piece for older students, unlocking math patterns proofs can spark useful conversation about how mathematical reasoning connects across topics, especially when students need to justify methods rather than just produce answers.
A short explainer can also help when you're introducing or revisiting core ideas:
If you're building several versions of these tasks for different readiness levels, one practical option is Kuraplan, which can generate lesson materials, visuals, and differentiated worksheets from the same lesson idea. That's useful when one class needs benchmark-percent practice and another is ready for multi-step applications.
Unpacking and Correcting Common Misconceptions
Students' percentage errors are often predictable. That's helpful, because predictable errors can be planned for. Instead of treating them as random mistakes, it's better to diagnose the thinking underneath them and reteach that specific idea.
One misconception that needs direct correction is the belief that 0% means 0/0. It doesn't. The documented pitfall is that students may treat 0% as 0/0 rather than 0/100, which causes later fraction and algebra problems to break down. A quick corrective mini-lesson should bring students back to the meaning of percent as parts per hundred and make the denominator visible again.
Common Percentage Misconceptions and How to Fix Them
| Misconception | What It Looks Like | Corrective Strategy |
|---|---|---|
| Percent is just a symbol added to a number | Student writes 7% because they see the number 7 in the problem | Return to a hundred grid or bar model and ask, “7 out of 100 of what?” |
| 0.5% is the same as 50% | Student treats decimal placement as cosmetic | Compare both on the same hundred model and discuss how much of the whole is shaded |
| The whole doesn't matter | Student finds a percent without identifying 100% first | Require students to label the whole before any operation |
| “Of” means add | Student writes an addition expression for a percent word problem | Rehearse the language translation routine with sentence strips and verbal rehearsal |
| 0% means 0/0 | Student writes an indeterminate fraction form | Re-teach percent as per hundred and write 0% as 0/100 explicitly |
Why these errors happen
Many percentage mistakes aren't calculation mistakes. They're representation mistakes. Students don't know which quantity is the whole, or they haven't connected the symbol to a part-whole relationship.
That's why pure correction isn't enough. Saying “that's wrong, multiply instead” might fix one item but won't repair the misconception.
Mini-lessons that actually help
A few interventions work consistently:
- Use one problem in three forms: visual, verbal, and symbolic.
- Ask for an estimate first: If a student says 50% of a quantity should be “tiny,” you've uncovered a meaning issue before the arithmetic starts.
- Contrast similar expressions: Put 50%, 0.5, and 0.5% side by side and ask what each represents.
- Have students name the whole out loud: It feels basic, but it prevents a surprising number of errors.
Wrong answers in percent problems often come from wrong identification of the whole, not weak computation.
The best correction is usually short and targeted. Rebuild the concept with a model, then return to the problem that caused the confusion.
Assessing Understanding and Differentiating Instruction
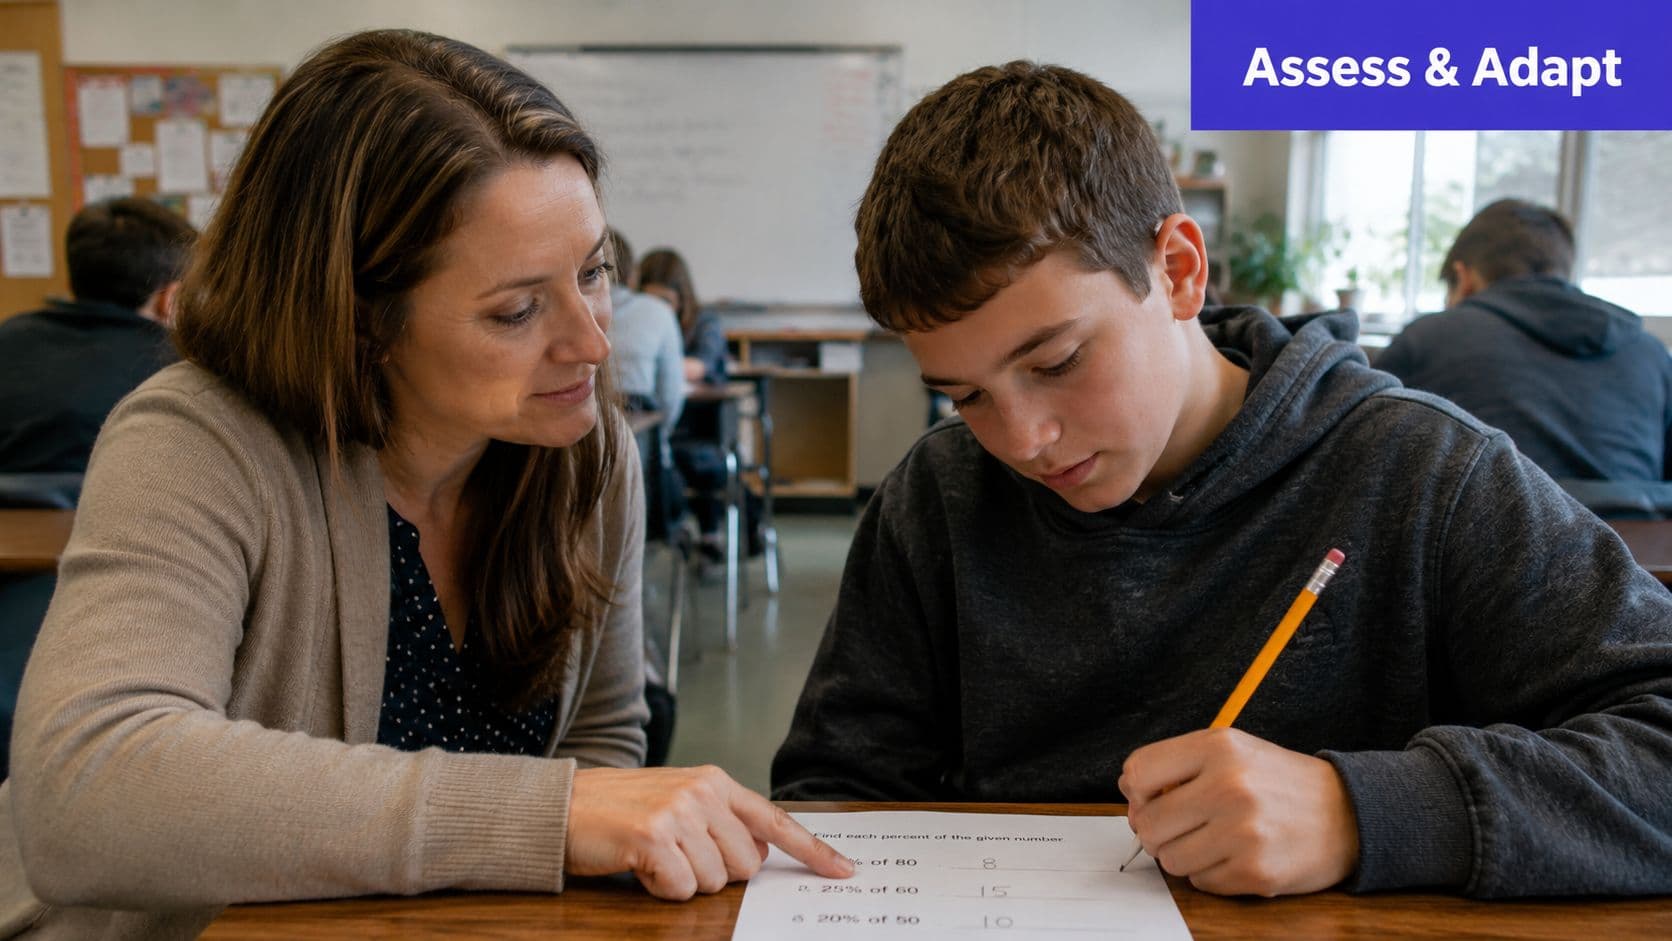
If assessment only asks students to compute, you'll miss a lot. A student can get the answer right using a memorized routine and still have no idea what the percentage means. Another student may choose an efficient benchmark strategy, explain it clearly, and reveal stronger understanding even if they make a small arithmetic slip.
That's why percentage assessment should include both formative checks and summative tasks. The most useful pattern mirrors a strong lesson structure described in Innovamat's percentage teaching guidance: begin with known and derived facts as anchors, move into word problems that require interpretation and decision-making, and finish with independent practice. That sequence gives you more than answers. It shows how students think.
What to assess besides the final answer
Look for evidence that students can:
- Identify the whole
- Choose a sensible strategy
- Move between visual and symbolic forms
- Explain whether an answer is reasonable
Useful prompts include asking students to create their own percent word problem, compare two discount situations, or explain why a classmate's method works.
Differentiation without doubling your prep load
Differentiating percent work gets messy fast if you build every task from scratch. In one class, some students need hundred grids and anchor percents. Others are ready for reverse-percent problems or richer applications.
The simplest way to manage that is to vary one task across:
- representation, such as concrete model, drawing, or equation
- number choice, using friendlier or less familiar values
- language demand, from direct prompts to multi-step contexts
For teachers who want to tighten their checks for understanding while keeping materials aligned, these formative assessment examples from Kuraplan are a practical starting point.
If you're building a full percentages unit and want help with lesson sequencing, differentiated worksheets, visuals, and assessment rubrics, Kuraplan is a practical planning tool for turning one good lesson idea into materials that fit a whole range of learners.