Comparing Distributions in Context
A free maths worksheet ready for your classroom. Open in Kuraplan to grab the print-ready PDF, customize it for your students, or generate a fresh version in seconds.
Comparing Distributions in Context
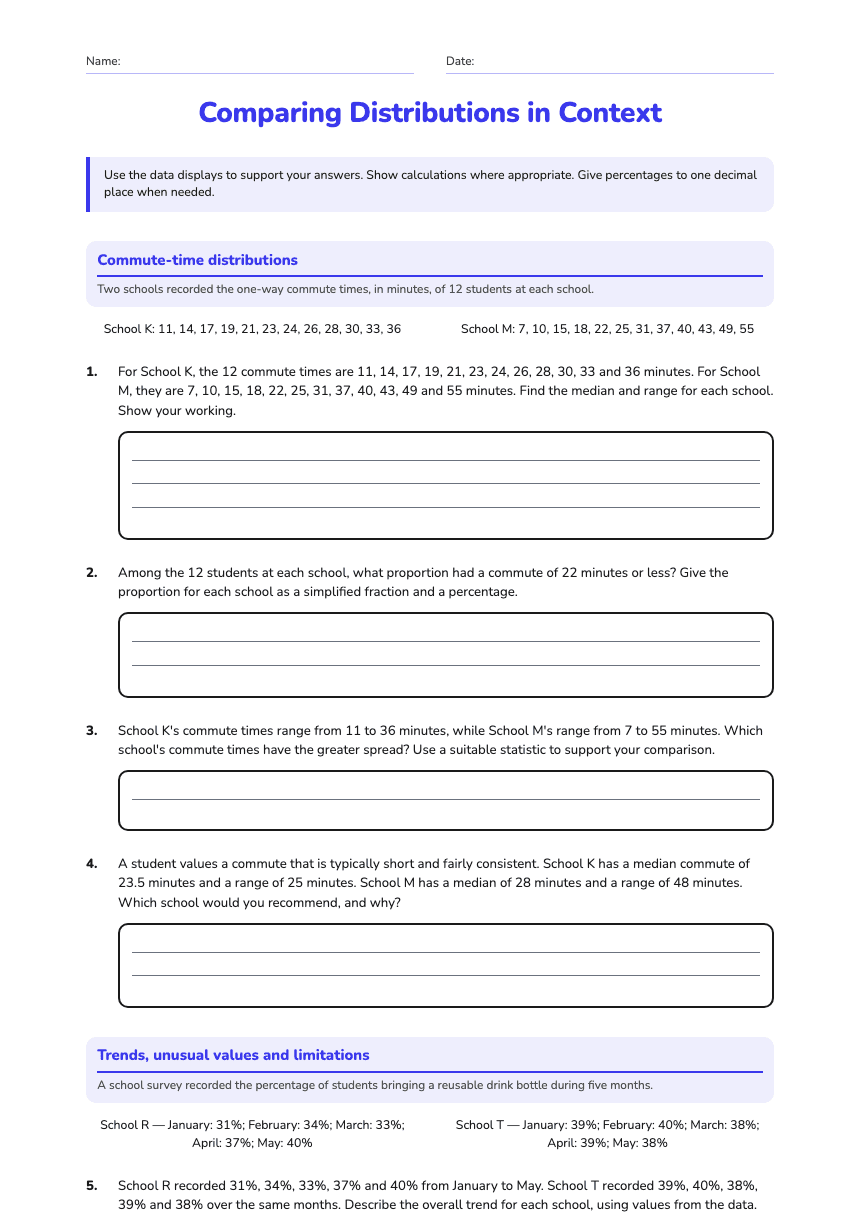
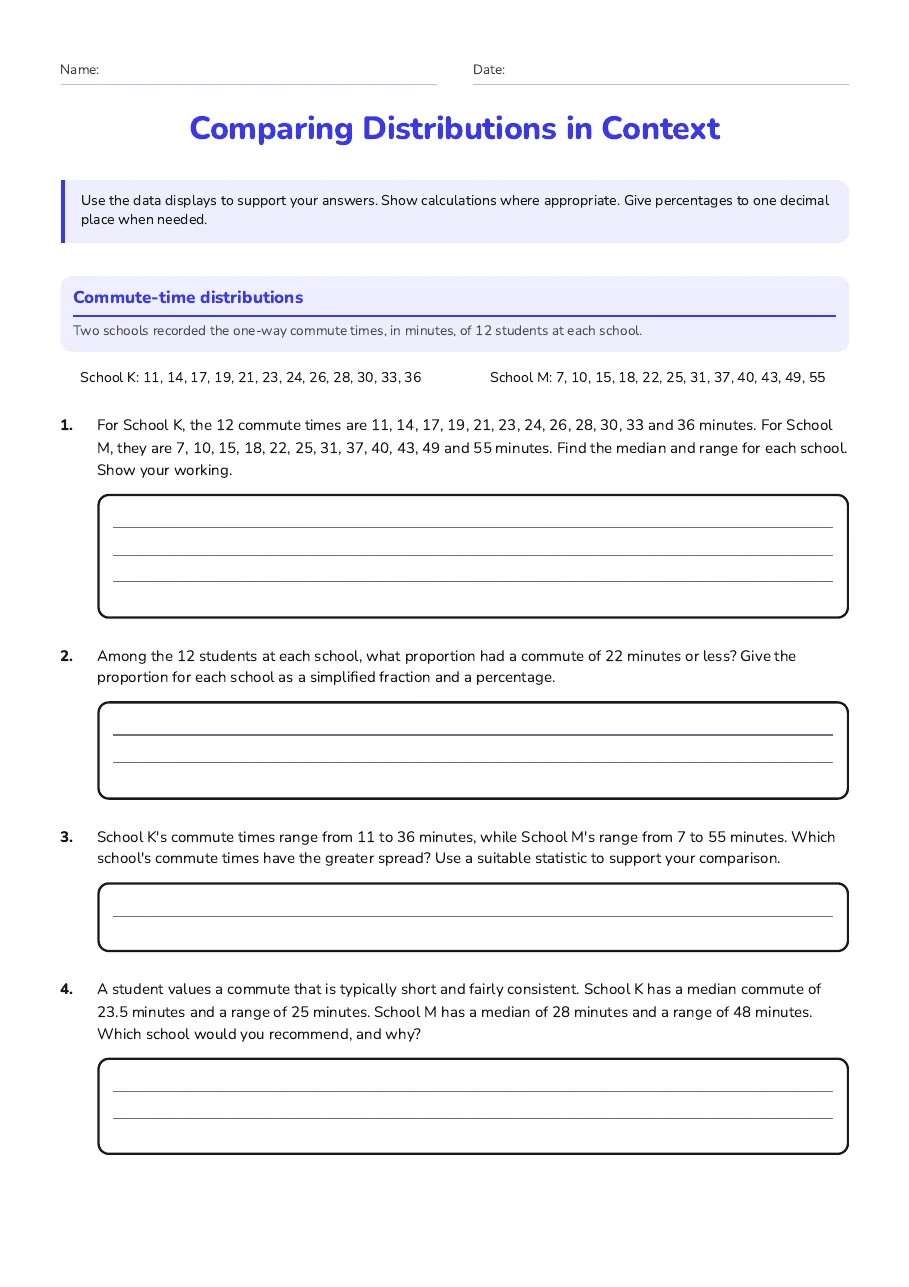
Commute-time distributions
Two schools recorded the one-way commute times, in minutes, of 12 students at each school.
School K: 11, 14, 17, 19, 21, 23, 24, 26, 28, 30, 33, 36
School M: 7, 10, 15, 18, 22, 25, 31, 37, 40, 43, 49, 55
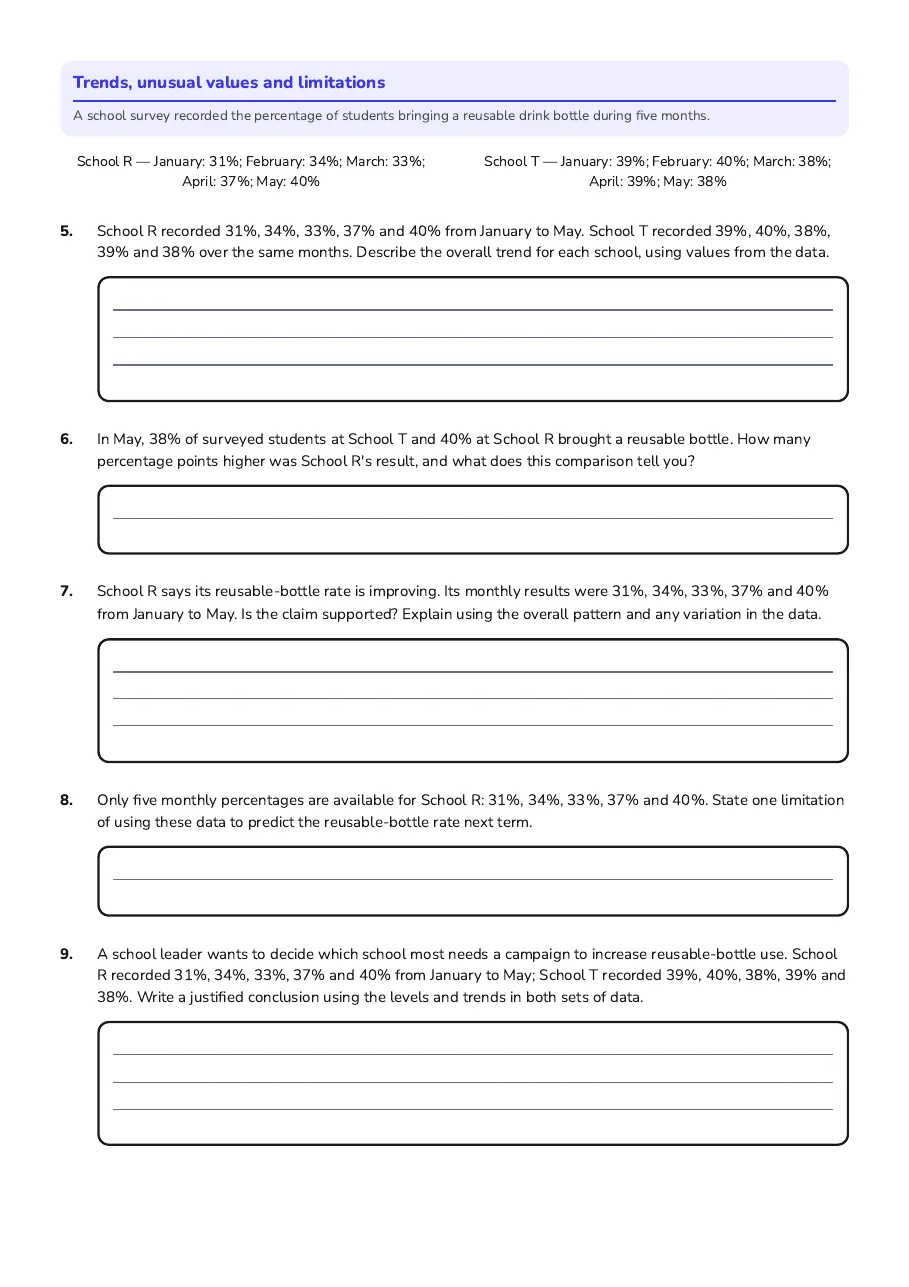
Trends, unusual values and limitations
A school survey recorded the percentage of students bringing a reusable drink bottle during five months.
School R — January: 31%; February: 34%; March: 33%; April: 37%; May: 40%
School T — January: 39%; February: 40%; March: 38%; April: 39%; May: 38%
2 printable pages
Page 1
Page 2
About This Worksheet
Free in Kuraplan
Sign up free, grab the PDF, and customize it for your class.
Print-Ready
Formatted for standard paper. Clean layout, easy to read.
AI-Generated
Created with Kuraplan's AI, designed for real classroom use.
For Teachers & Parents
Use in classrooms, for homework, tutoring, or homeschool.
Need a custom version of this worksheet?
Kuraplan's AI generates custom worksheets in seconds — differentiated for every learner, aligned to your curriculum.
Generate Custom Worksheets — Free