MathsFreePrintable

Interpreting Statistical Information

A free maths worksheet ready for your classroom. Open in Kuraplan to grab the print-ready PDF, customize it for your students, or generate a fresh version in seconds.
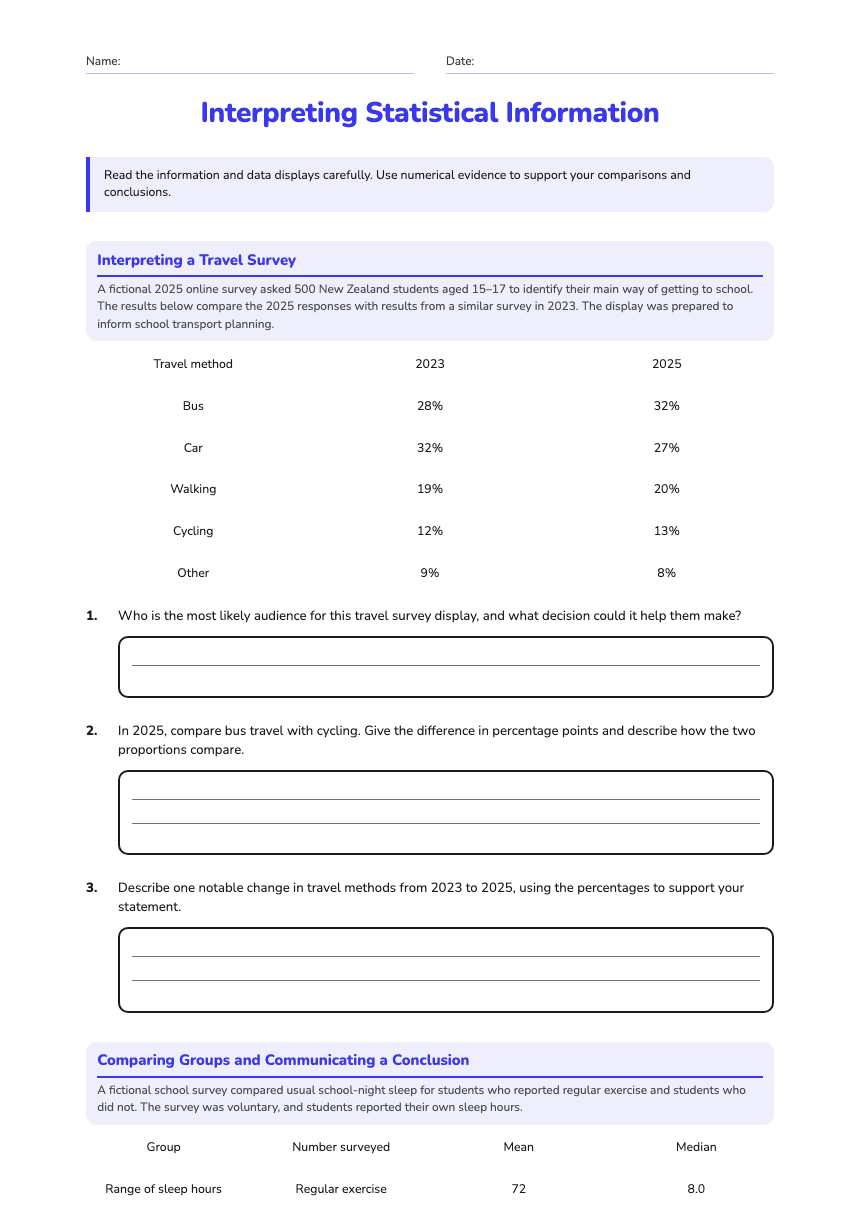
Interpreting Statistical Information worksheet preview

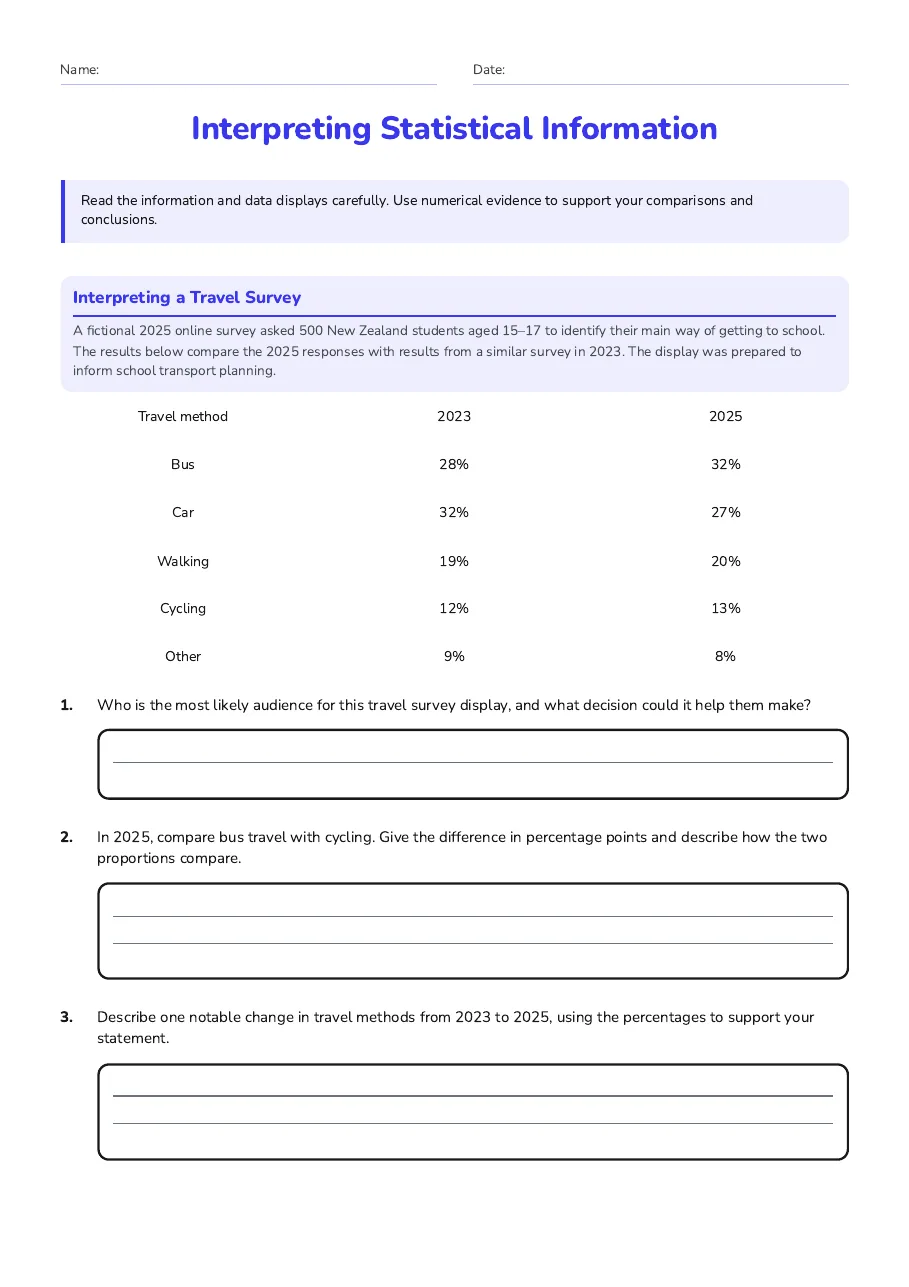
Interpreting Statistical Information

Worksheet illustration

Part 1: Interpreting a Media-Style Infographic

Classroom-created infographic: How Year 12 students travel to school

A 2024 online survey of 600 New Zealand students aged 15–17 asked for their main way of travelling to school.

2024 results: Bus 34%   Car 29%   Walking 18%   Cycling 11%   Other 8%

Change since 2022: Bus increased from 29% to 34%; car decreased from 35% to 29%; walking increased from 17% to 18%; cycling increased from 10% to 11%; other decreased from 9% to 8%.

Purpose of the infographic: to inform school leaders about students’ travel patterns when planning transport options.

1. Who is the likely audience for this infographic, and what is its purpose?
2. Compare bus travel with cycling in 2024. Include both a difference in percentage points and a suitable statement about the relative sizes.
3. Describe one important trend between 2022 and 2024. Support your answer with numerical evidence.

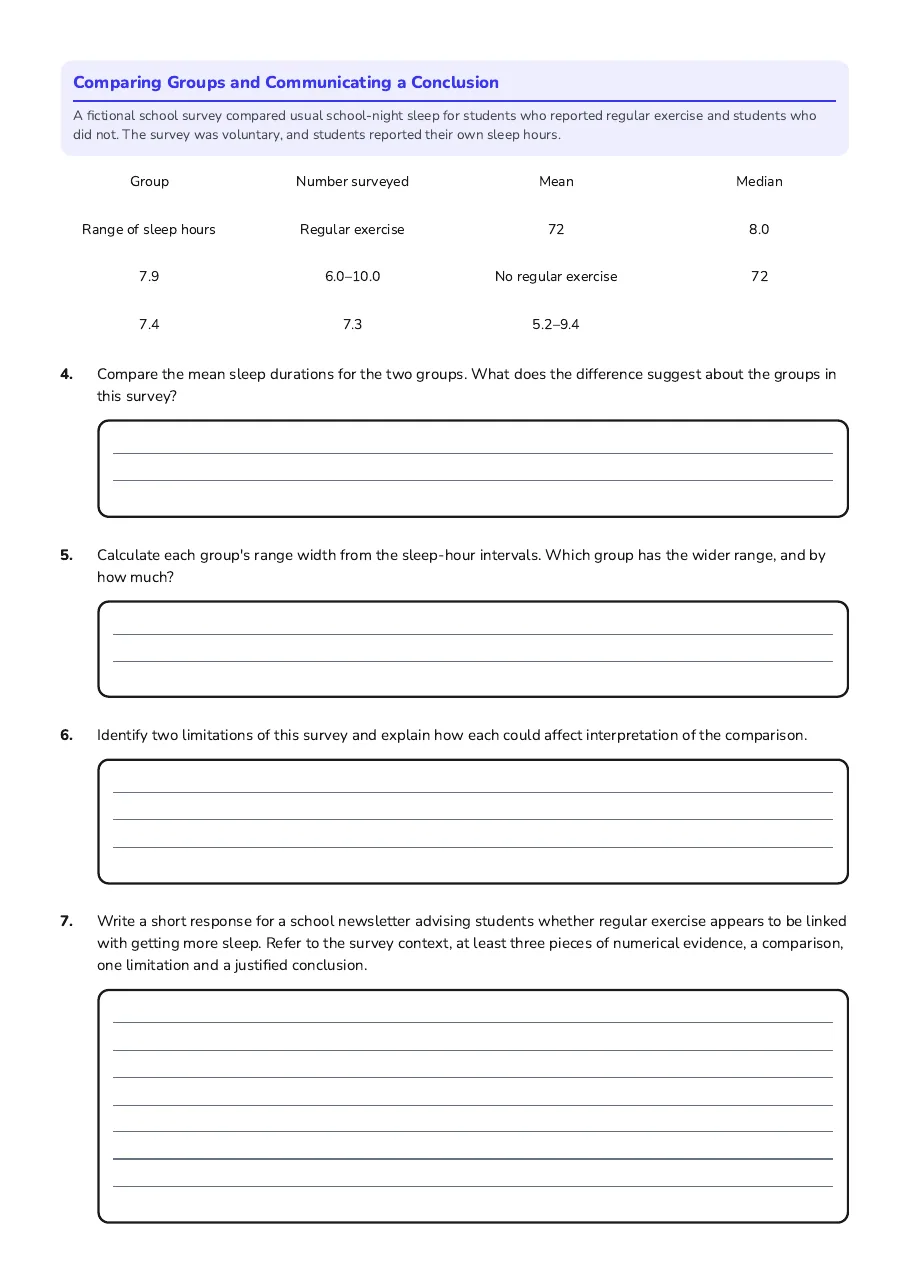
Part 2: Comparing Two Groups and Writing a Response

A school surveyed 160 students about sleep and regular exercise. Students were asked how many hours they usually slept on a school night.

Regular exercise group: 80 students; mean 8.1 hours; median 8.0 hours; range 6.2–10.2 hours.

No regular exercise group: 80 students; mean 7.3 hours; median 7.2 hours; range 5.1–9.5 hours.

The survey was voluntary and self-reported. It shows an association between the variables, not necessarily a cause-and-effect relationship.

4. Compare the typical sleep of the two groups using the means. State the difference and explain what it suggests.
5. Compare the spread of the two groups using their ranges. Which group has the greater range, and by how much?
6. Identify two limitations of this survey. Explain why each limitation matters when interpreting the results.
7. Specified purpose: Write a coherent response for a school newsletter advising students whether regular exercise appears to be linked with getting more sleep. Refer to the context, at least three pieces of evidence, a comparison, a limitation, and a justified conclusion.

Achievement checklist

Before submitting, check that your response includes:

□ The purpose and intended audience

□ Relevant context about the survey

□ Accurate statistical evidence

□ Clear comparisons between the groups

□ A relevant trend or relationship

□ At least one meaningful limitation

□ A justified conclusion that answers the specified purpose

About This Worksheet

Free in Kuraplan

Sign up free, grab the PDF, and customize it for your class.

Print-Ready

Formatted for standard paper. Clean layout, easy to read.

AI-Generated

Created with Kuraplan's AI, designed for real classroom use.

For Teachers & Parents

Use in classrooms, for homework, tutoring, or homeschool.

Need a custom version of this worksheet?

Kuraplan's AI generates custom worksheets in seconds — differentiated for every learner, aligned to your curriculum.

Generate Custom Worksheets — Free
No credit card Curriculum-aligned Under 60 seconds