MathsFreePrintable
Our Favourite Fruit Data Worksheet
A free maths worksheet ready for your classroom. Open in Kuraplan to grab the print-ready PDF, customize it for your students, or generate a fresh version in seconds.
Name:Date:
Our Favourite Fruit Data Worksheet
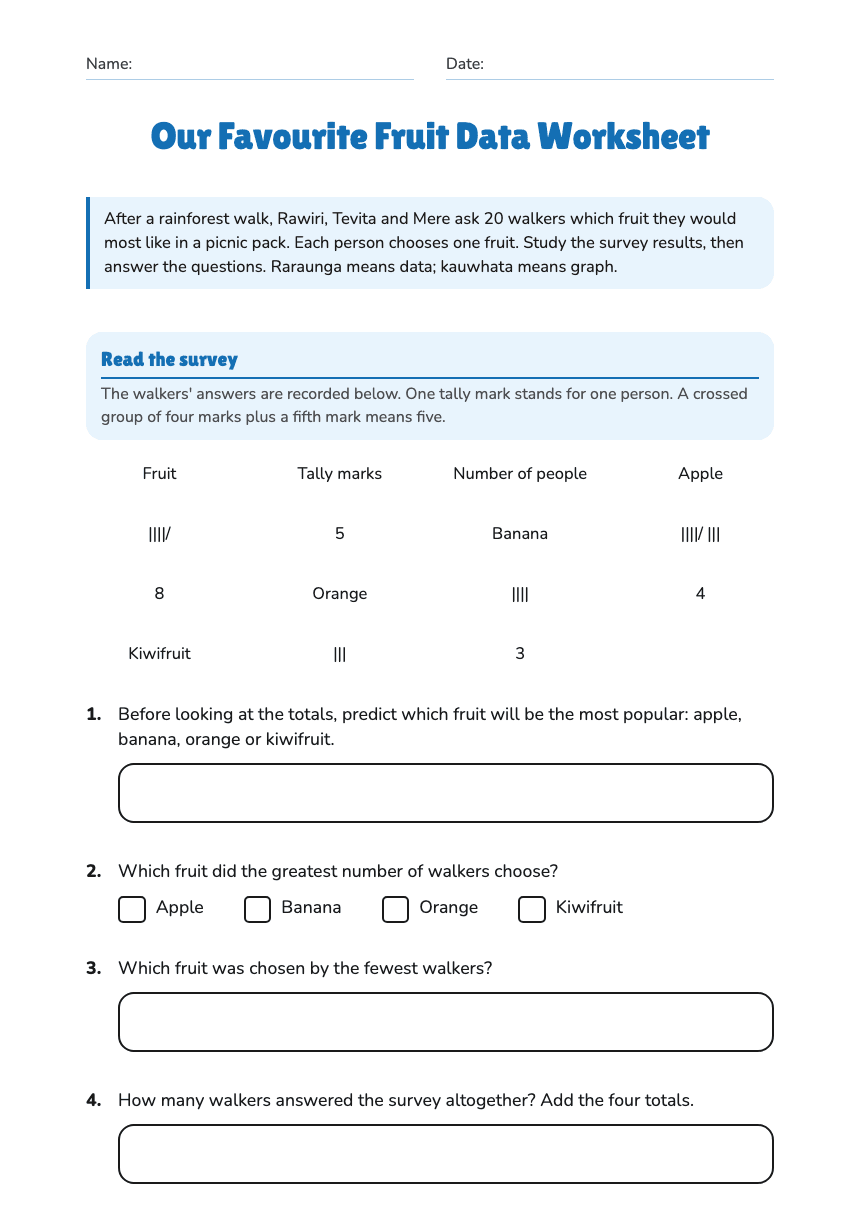
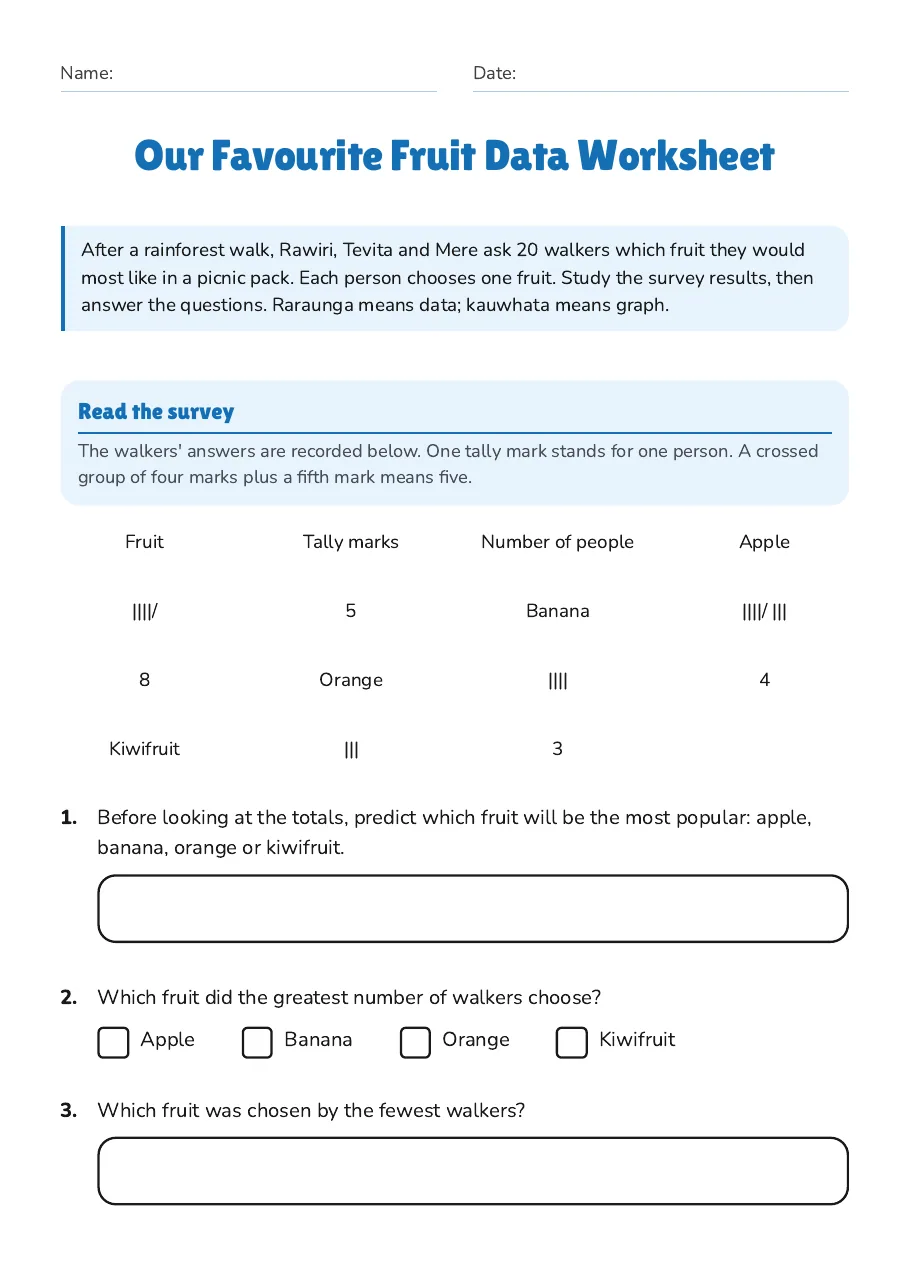
After a rainforest walk, Rawiri, Tevita and Mere ask 20 walkers which fruit they would most like in a picnic pack. Each person chooses one fruit. Study the survey results, then answer the questions. Raraunga means data; kauwhata means graph.
Read the survey
The walkers' answers are recorded below. One tally mark stands for one person. A crossed group of four marks plus a fifth mark means five.
Fruit
Tally marks
Number of people
Apple
||||/
5
Banana
||||/ |||
8
Orange
||||
4
Kiwifruit
|||
3
1.Before looking at the totals, predict which fruit will be the most popular: apple, banana, orange or kiwifruit.
2.Which fruit did the greatest number of walkers choose?
- Apple
- Banana
- Orange
- Kiwifruit
3.Which fruit was chosen by the fewest walkers?
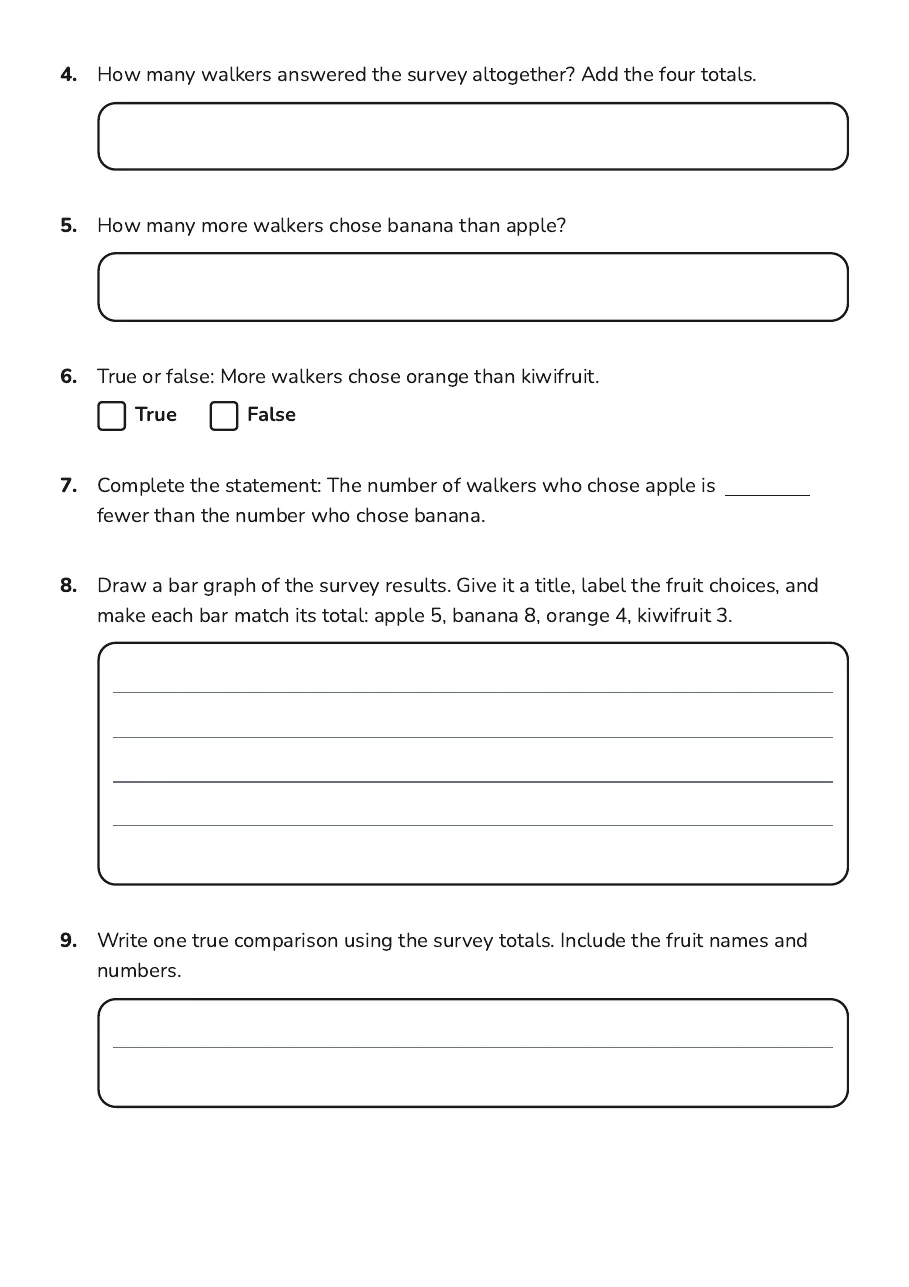
4.How many walkers answered the survey altogether? Add the four totals.
5.How many more walkers chose banana than apple?
6.True or false: More walkers chose orange than kiwifruit.
TrueFalse
7.Complete the statement: The number of walkers who chose apple is fewer than the number who chose banana.
8.Draw a bar graph of the survey results. Give it a title, label the fruit choices, and make each bar match its total: apple 5, banana 8, orange 4, kiwifruit 3.
9.Write one true comparison using the survey totals. Include the fruit names and numbers.
2 printable pages
Page 1
Page 2
About This Worksheet
Free in Kuraplan
Sign up free, grab the PDF, and customize it for your class.
Print-Ready
Formatted for standard paper. Clean layout, easy to read.
AI-Generated
Created with Kuraplan's AI, designed for real classroom use.
For Teachers & Parents
Use in classrooms, for homework, tutoring, or homeschool.
Need a custom version of this worksheet?
Kuraplan's AI generates custom worksheets in seconds — differentiated for every learner, aligned to your curriculum.
Generate Custom Worksheets — Free No credit card Curriculum-aligned Under 60 seconds