Tauanga Data Investigations
A free maths worksheet ready for your classroom. Open in Kuraplan to grab the print-ready PDF, customize it for your students, or generate a fresh version in seconds.
Tauanga Data Investigations
Core: Kohikohi raraunga — Collecting data (Years 3–4)
Learning intention: We are learning to collect, sort and display categorical data.
Success criteria: I can ask a clear question, record answers using tally marks, count frequencies and describe what my data shows.
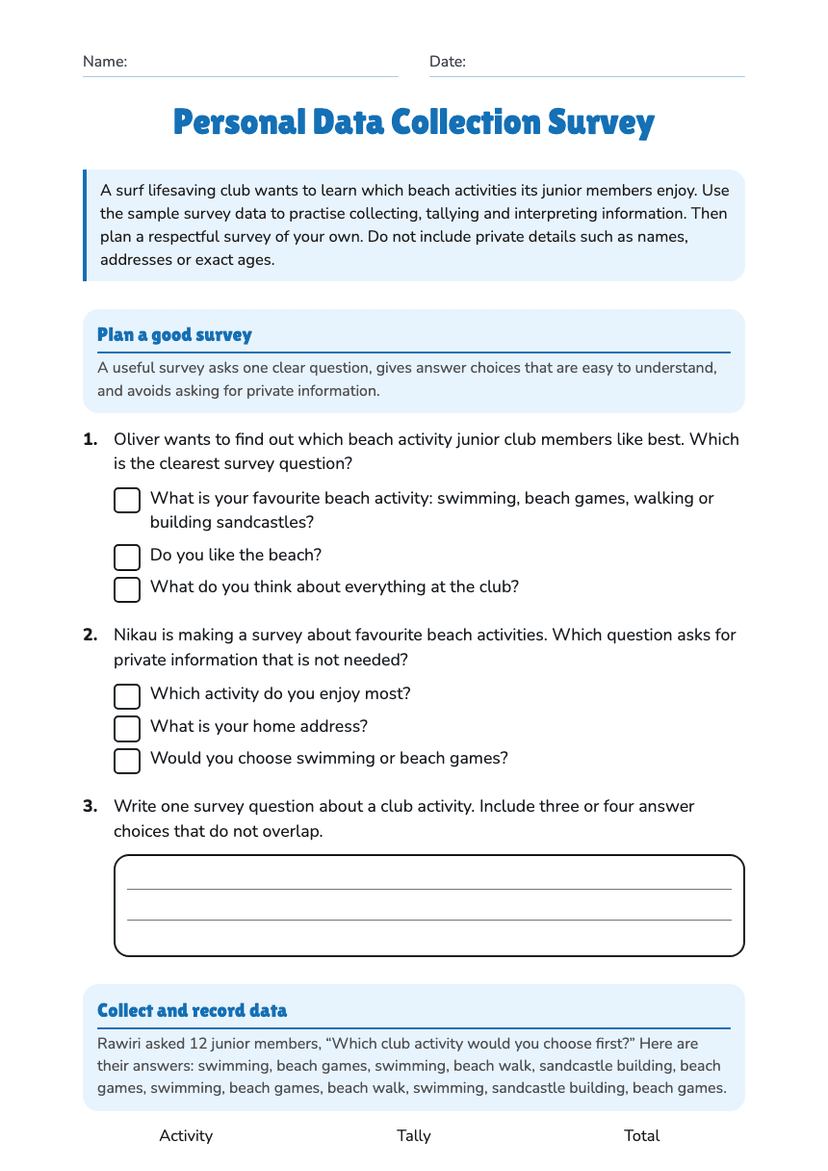
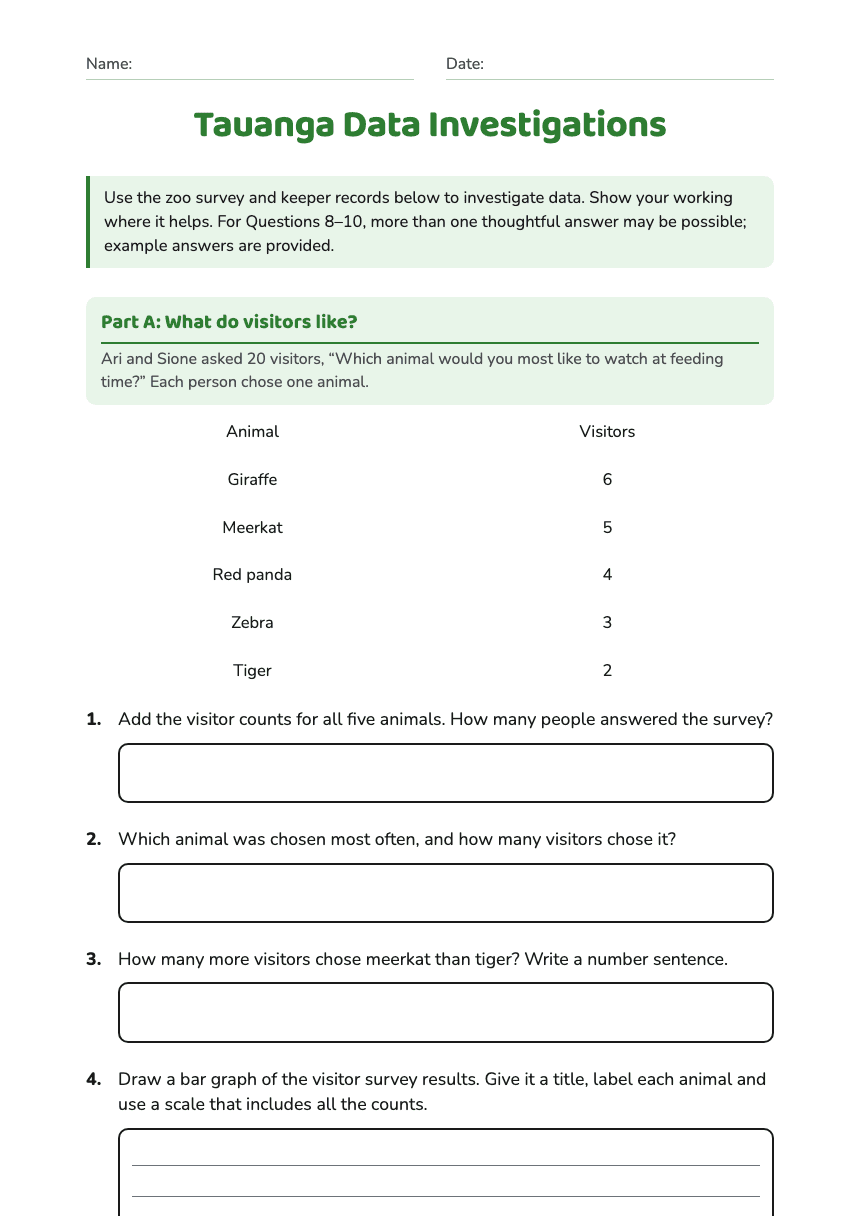
Preferred fruit: apple, banana, orange or other.
Optional teacher-approved alternative: How do you travel to school?
My survey question: ____________________________________________________________
My categories: _________________________________________________________________
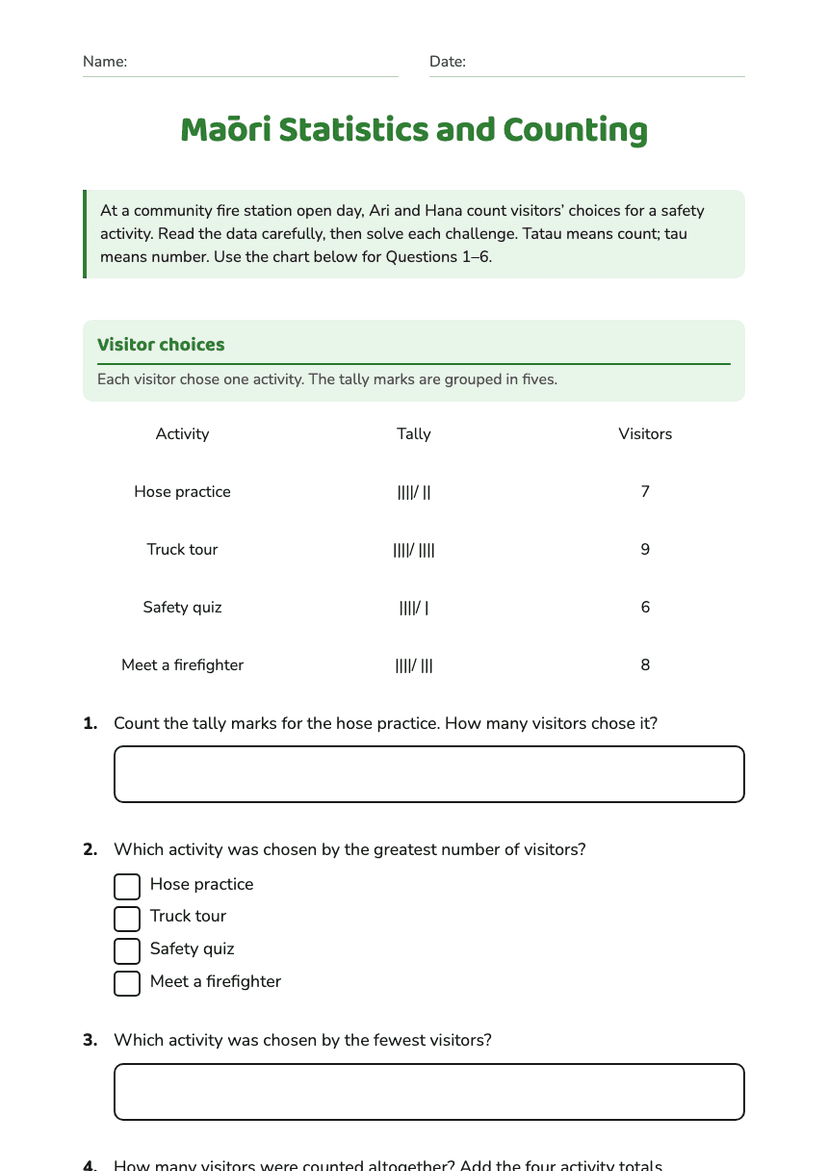
Category Tally Frequency
________________ __________________ __________
________________ __________________ __________
________________ __________________ __________
________________ __________________ __________
Total responses: __________
Extend: Te huringa tūhuratanga — Statistical investigation (Years 5–6)
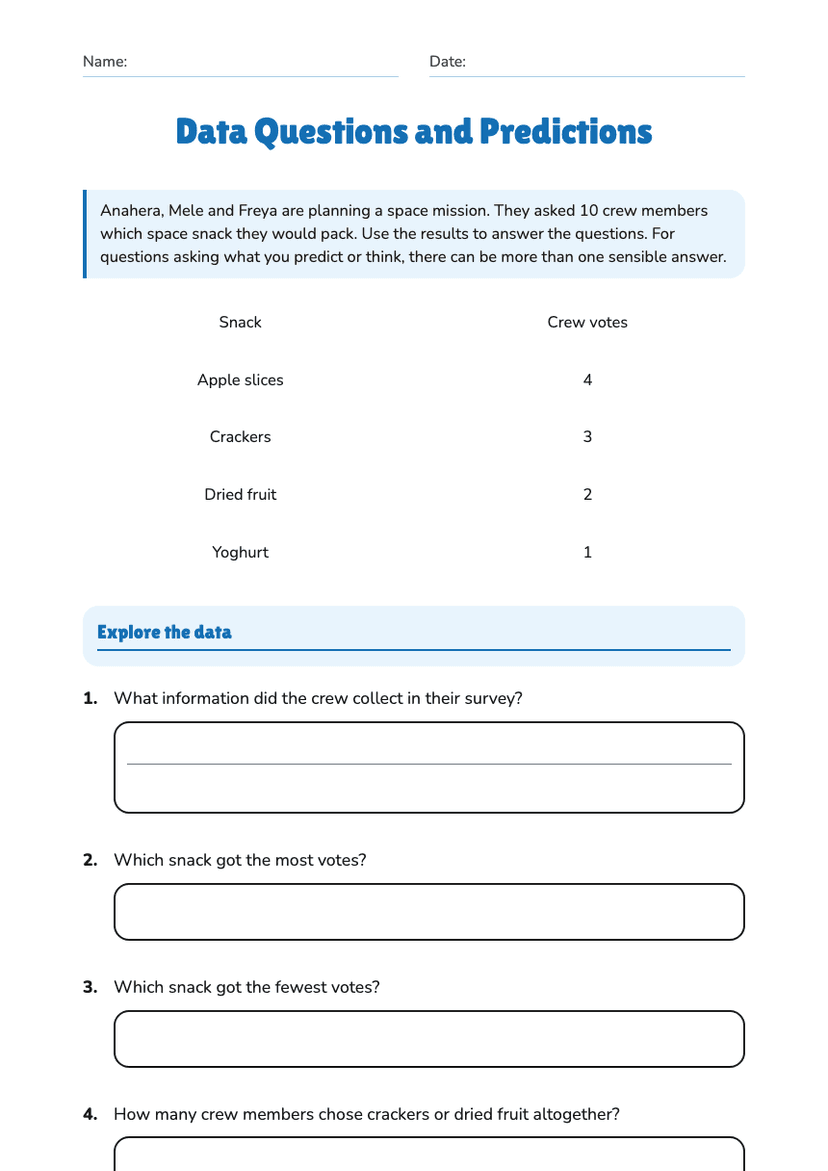
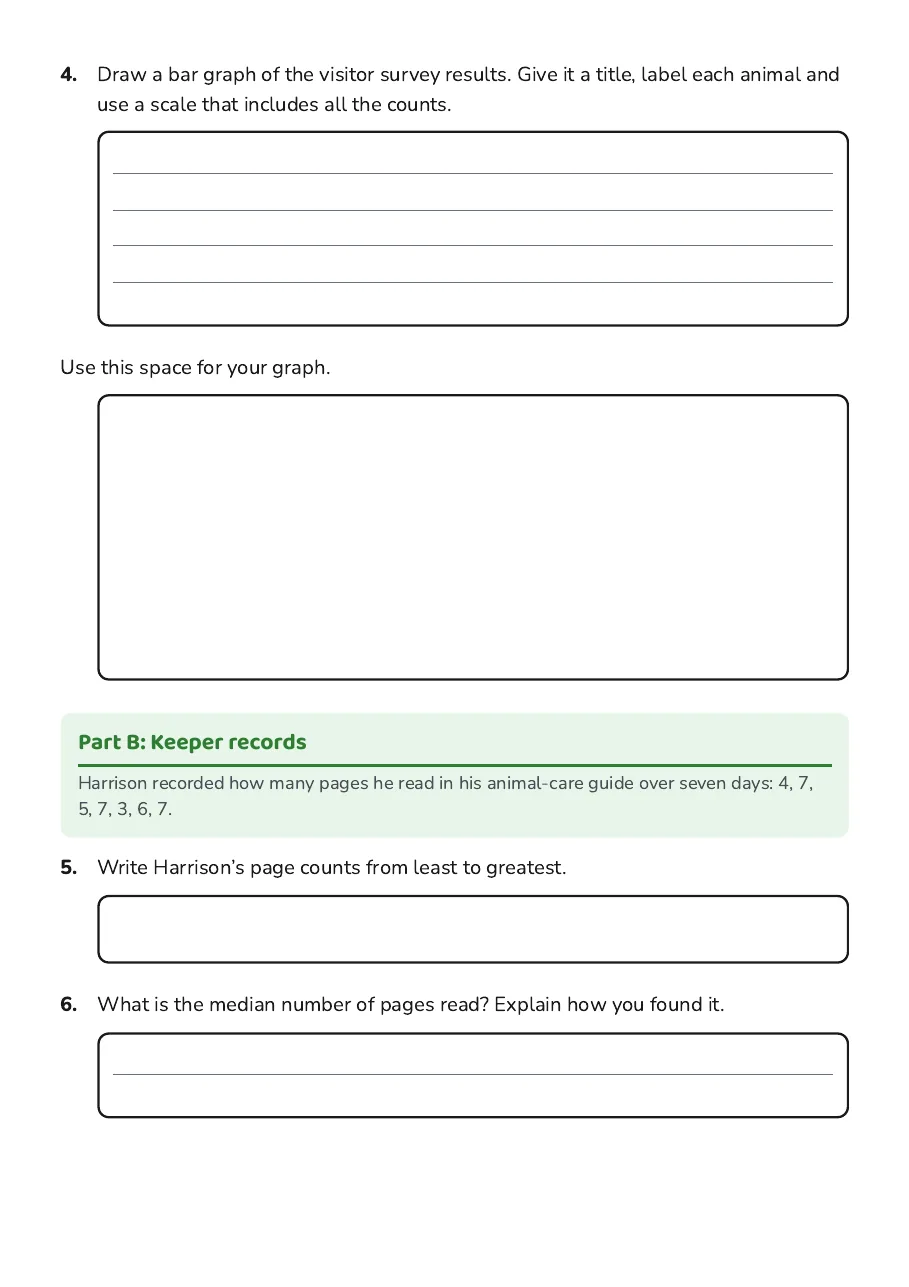
Use the numerical data below. It shows the number of pages read by nine learners in one week:
4, 7, 5, 7, 3, 6, 7, 5, 2
________________________________________________________________________________
Least: __________ Greatest: __________ Most common: __________
Range: __________ Median: __________
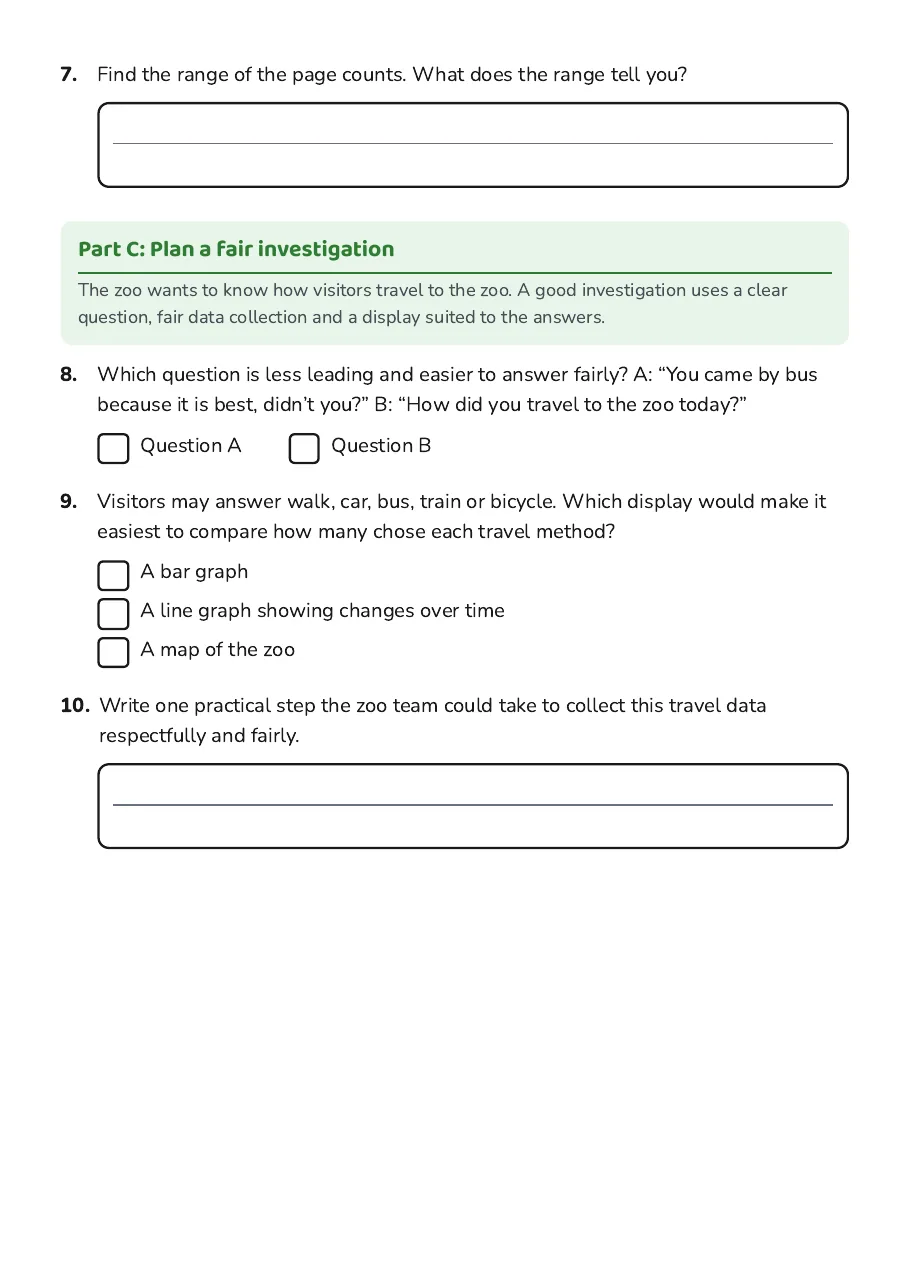
Challenge: Pātai tūhuratanga and responsible data (Year 7)
Example: How does the class travel to school on a typical day?
Teacher guidance and likely answers
Question 5: 2, 3, 4, 5, 5, 6, 7, 7, 7.
Question 6: Least = 2; greatest = 7; most common = 7; range = 5; median = 5.
Questions 1–4: Answers depend on the class survey. Check that every response is included once, tally marks are grouped in fives, frequencies are correct, the total matches the number surveyed, and the graph matches the table.
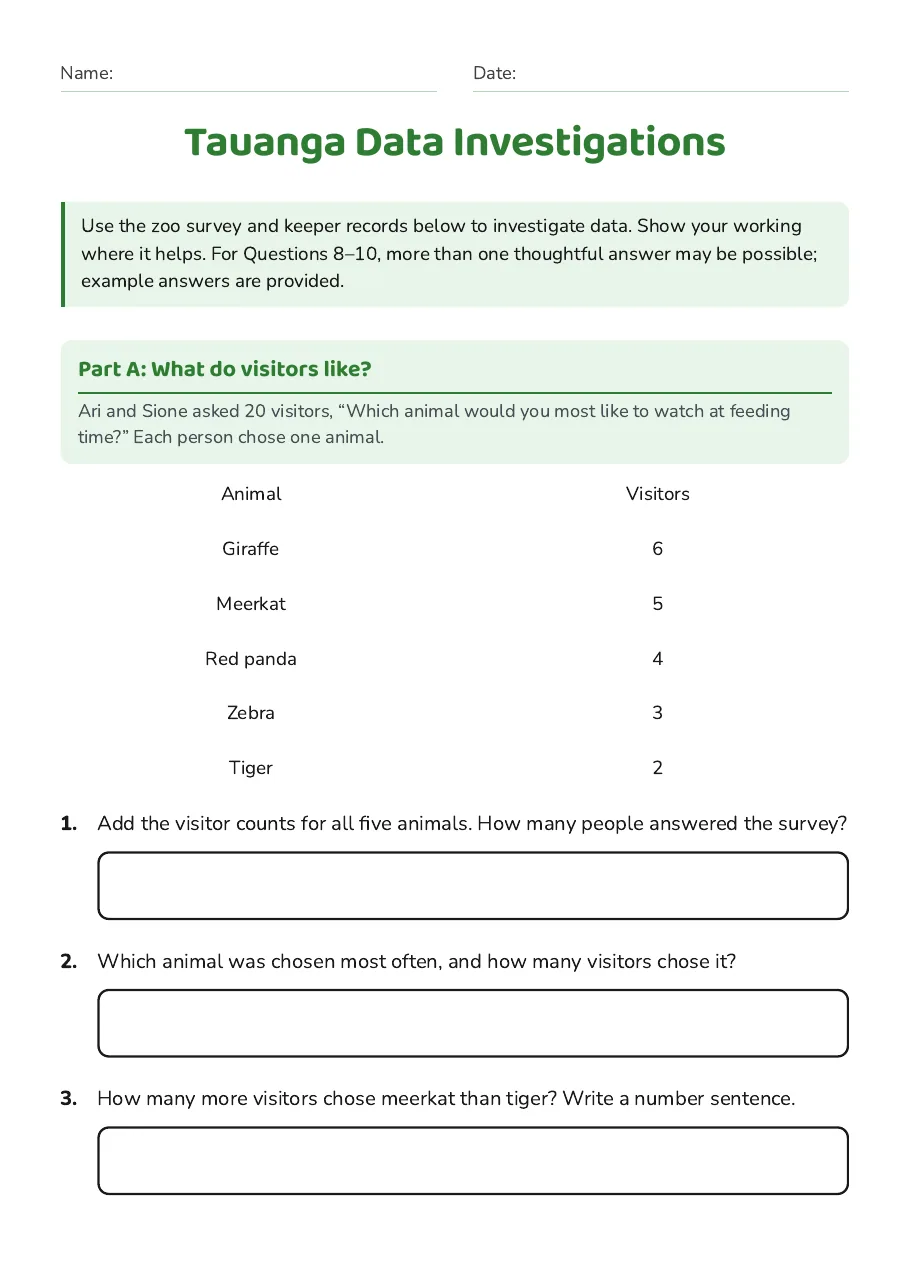
Questions 7–9: Accept evidence-based responses. Possible observations include that 7 is the mode, the values range from 2 to 7, and the median is 5. Limitations may include a small sample, surveying only one group, unclear categories, asking at one time of day, or people choosing an answer they think is expected.
Questions 10–12: Look for a measurable investigative question, a suitable display such as a bar graph for categories or a dot plot for numerical data, and a conclusion supported by frequencies or numerical values. Responsible collection should be voluntary, respectful, anonymous where appropriate and free from leading questions.
About This Worksheet
Free in Kuraplan
Sign up free, grab the PDF, and customize it for your class.
Print-Ready
Formatted for standard paper. Clean layout, easy to read.
AI-Generated
Created with Kuraplan's AI, designed for real classroom use.
For Teachers & Parents
Use in classrooms, for homework, tutoring, or homeschool.
Need a custom version of this worksheet?
Kuraplan's AI generates custom worksheets in seconds — differentiated for every learner, aligned to your curriculum.
Generate Custom Worksheets — Free