Social SciencesFreePrintable

Understanding Aggregate Demand

A free social sciences worksheet ready for your classroom. Open in Kuraplan to grab the print-ready PDF, customize it for your students, or generate a fresh version in seconds.
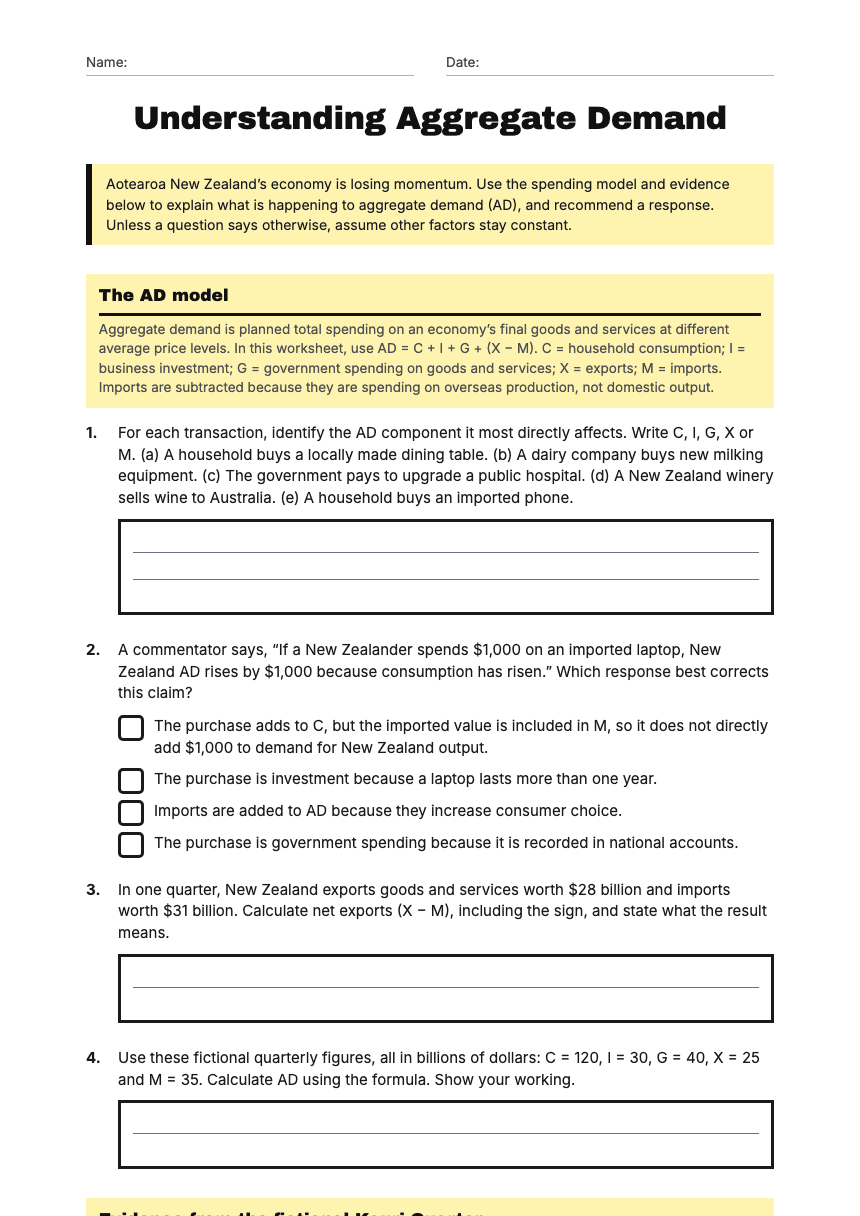
Understanding Aggregate Demand worksheet preview
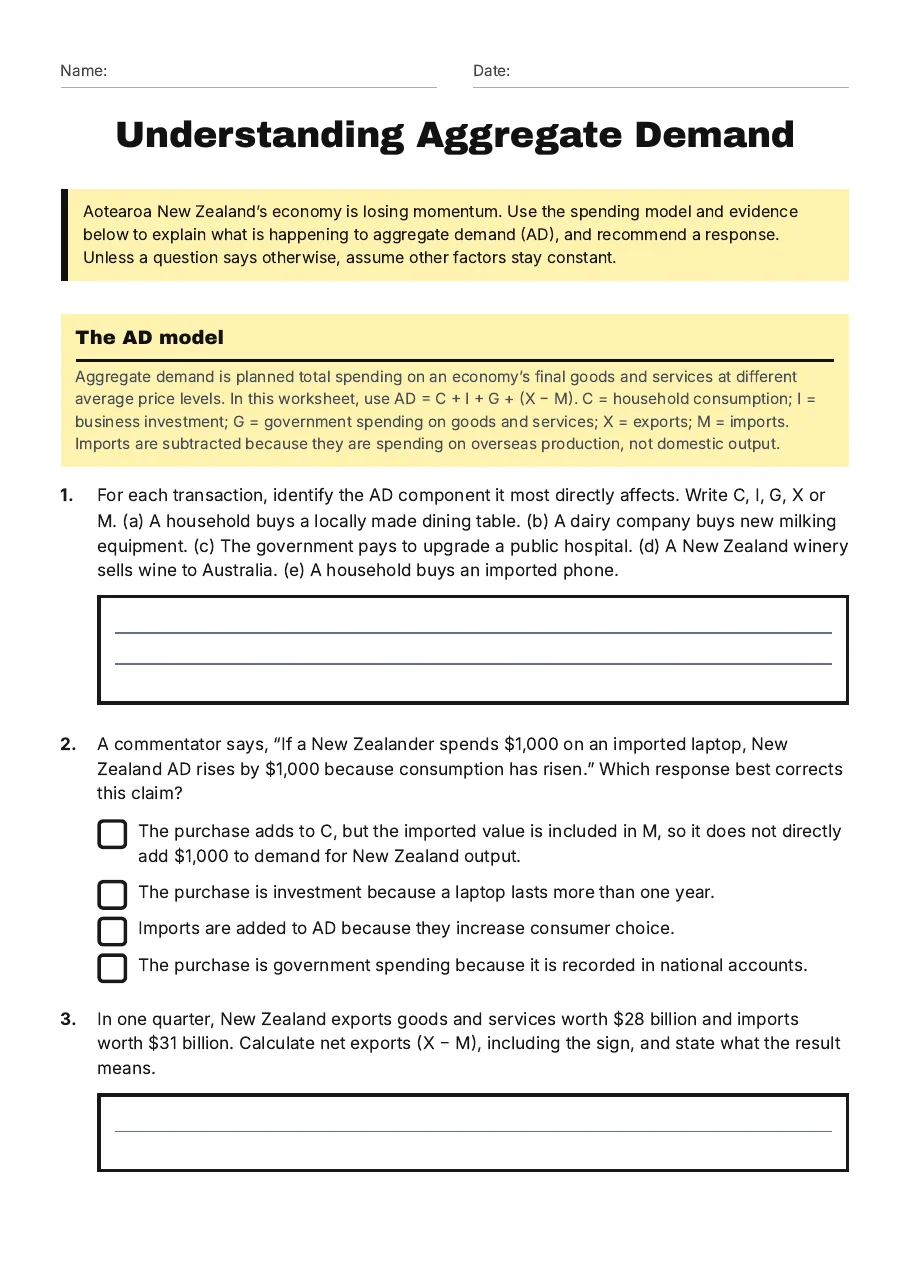
Name:Date:

Understanding Aggregate Demand

Aotearoa New Zealand’s economy is losing momentum. Use the spending model and evidence below to explain what is happening to aggregate demand (AD), and recommend a response. Unless a question says otherwise, assume other factors stay constant.

The AD model

Aggregate demand is planned total spending on an economy’s final goods and services at different average price levels. In this worksheet, use AD = C + I + G + (X − M). C = household consumption; I = business investment; G = government spending on goods and services; X = exports; M = imports. Imports are subtracted because they are spending on overseas production, not domestic output.

1.For each transaction, identify the AD component it most directly affects. Write C, I, G, X or M. (a) A household buys a locally made dining table. (b) A dairy company buys new milking equipment. (c) The government pays to upgrade a public hospital. (d) A New Zealand winery sells wine to Australia. (e) A household buys an imported phone.
2.A commentator says, “If a New Zealander spends $1,000 on an imported laptop, New Zealand AD rises by $1,000 because consumption has risen.” Which response best corrects this claim?
  • The purchase adds to C, but the imported value is included in M, so it does not directly add $1,000 to demand for New Zealand output.
  • The purchase is investment because a laptop lasts more than one year.
  • Imports are added to AD because they increase consumer choice.
  • The purchase is government spending because it is recorded in national accounts.
3.In one quarter, New Zealand exports goods and services worth $28 billion and imports worth $31 billion. Calculate net exports (X − M), including the sign, and state what the result means.
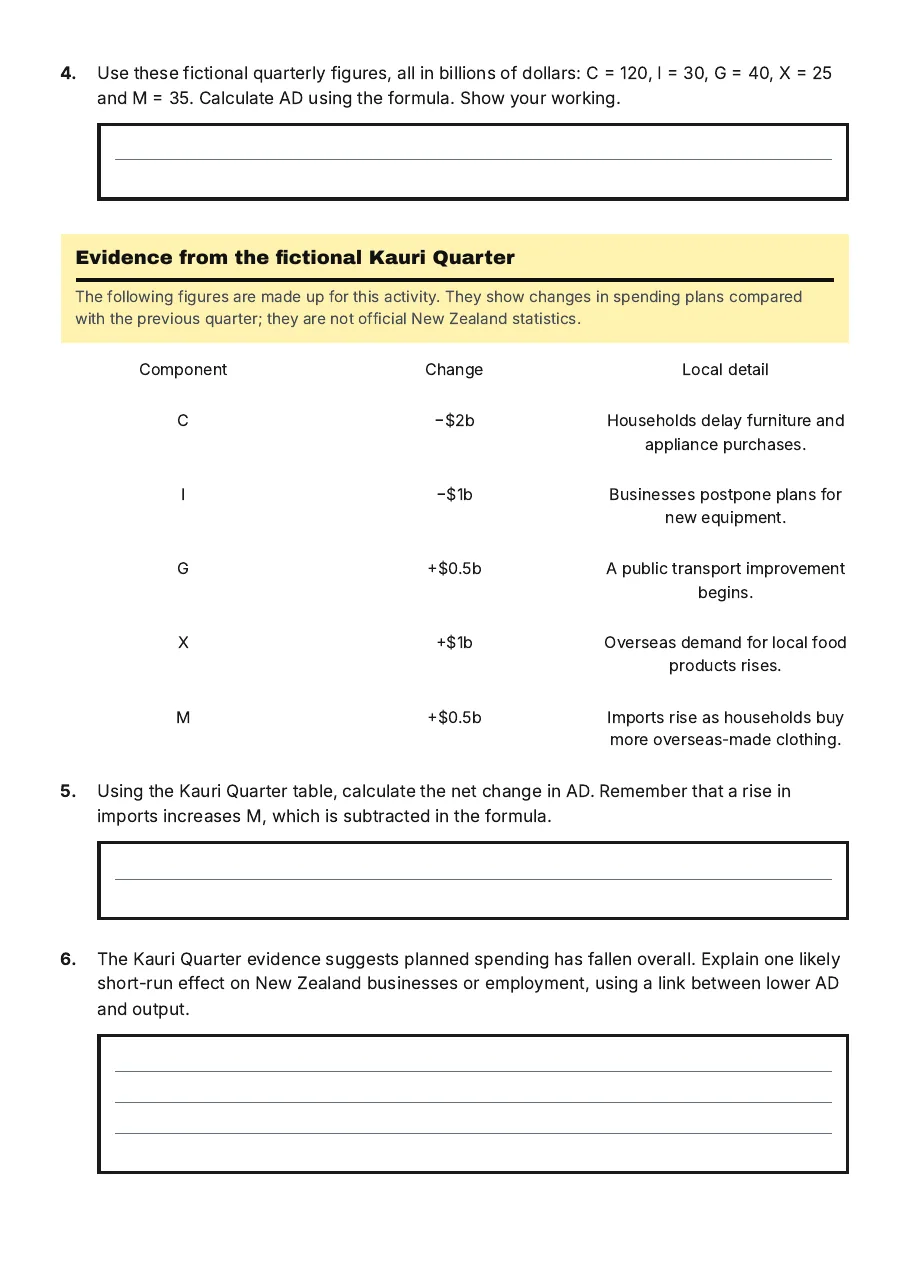
4.Use these fictional quarterly figures, all in billions of dollars: C = 120, I = 30, G = 40, X = 25 and M = 35. Calculate AD using the formula. Show your working.

Evidence from the fictional Kauri Quarter

The following figures are made up for this activity. They show changes in spending plans compared with the previous quarter; they are not official New Zealand statistics.

Component

Change

Local detail

C

−$2b

Households delay furniture and appliance purchases.

I

−$1b

Businesses postpone plans for new equipment.

G

+$0.5b

A public transport improvement begins.

X

+$1b

Overseas demand for local food products rises.

M

+$0.5b

Imports rise as households buy more overseas-made clothing.

5.Using the Kauri Quarter table, calculate the net change in AD. Remember that a rise in imports increases M, which is subtracted in the formula.
6.The Kauri Quarter evidence suggests planned spending has fallen overall. Explain one likely short-run effect on New Zealand businesses or employment, using a link between lower AD and output.
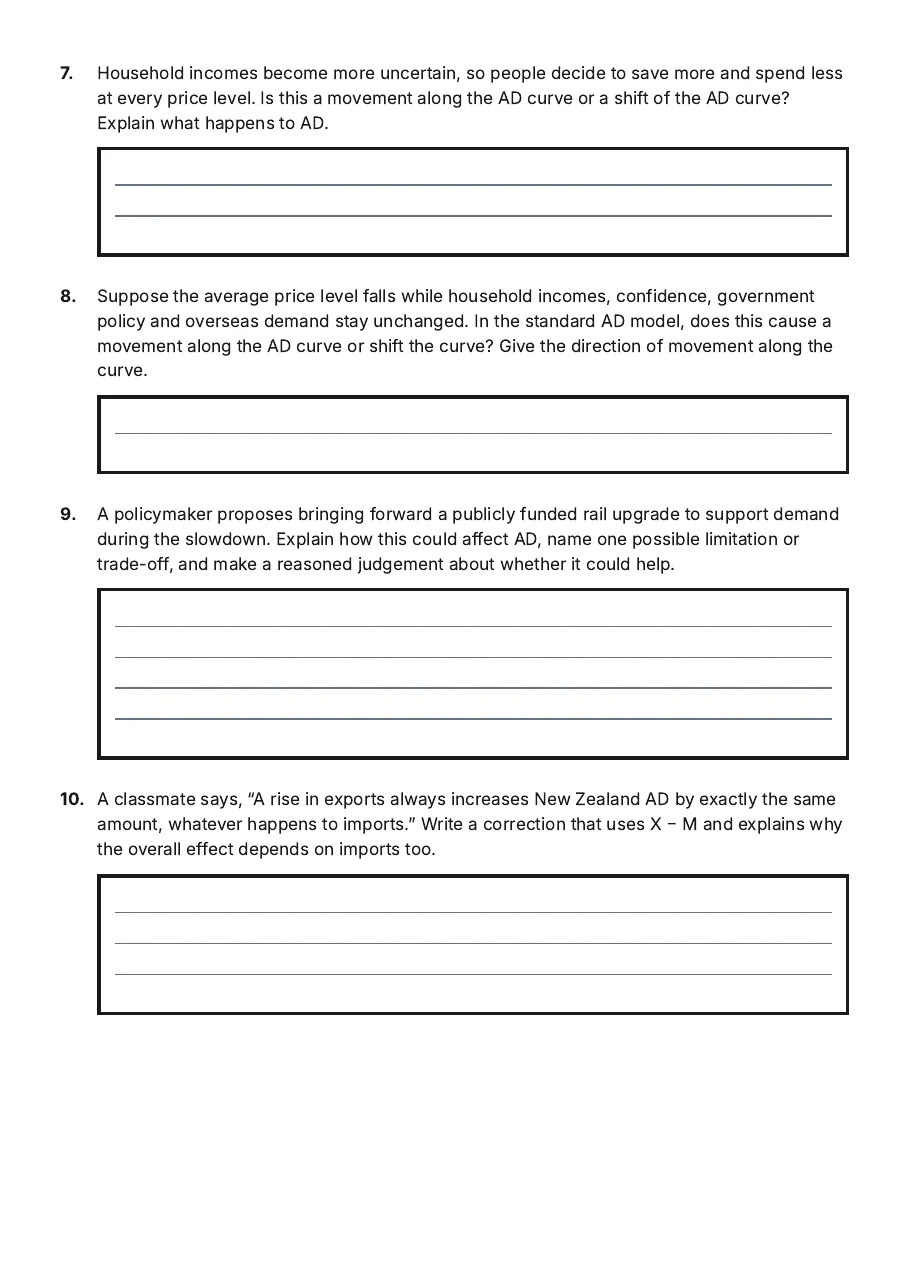
7.Household incomes become more uncertain, so people decide to save more and spend less at every price level. Is this a movement along the AD curve or a shift of the AD curve? Explain what happens to AD.
8.Suppose the average price level falls while household incomes, confidence, government policy and overseas demand stay unchanged. In the standard AD model, does this cause a movement along the AD curve or shift the curve? Give the direction of movement along the curve.
9.A policymaker proposes bringing forward a publicly funded rail upgrade to support demand during the slowdown. Explain how this could affect AD, name one possible limitation or trade-off, and make a reasoned judgement about whether it could help.
10.A classmate says, “A rise in exports always increases New Zealand AD by exactly the same amount, whatever happens to imports.” Write a correction that uses X − M and explains why the overall effect depends on imports too.

3 printable pages

  • Understanding Aggregate Demand, page 1 of 3: The AD model

    Page 1

  • Understanding Aggregate Demand, page 2 of 3: Evidence from the fictional Kauri Quarter

    Page 2

  • Understanding Aggregate Demand, page 3 of 3: 7. Household incomes become more uncertain, so people decide to save more and spend less

    Page 3

About This Worksheet

Free in Kuraplan

Sign up free, grab the PDF, and customize it for your class.

Print-Ready

Formatted for standard paper. Clean layout, easy to read.

AI-Generated

Created with Kuraplan's AI, designed for real classroom use.

For Teachers & Parents

Use in classrooms, for homework, tutoring, or homeschool.

Need a custom version of this worksheet?

Kuraplan's AI generates custom worksheets in seconds — differentiated for every learner, aligned to your curriculum.

Generate Custom Worksheets — Free
No credit card Curriculum-aligned Under 60 seconds