MathsFreePrintable

Kinematics Graphs Worksheet

A free maths worksheet ready for your classroom. Open in Kuraplan to grab the print-ready PDF, customize it for your students, or generate a fresh version in seconds.
Kinematics Graphs Worksheet worksheet preview
Name:Date:

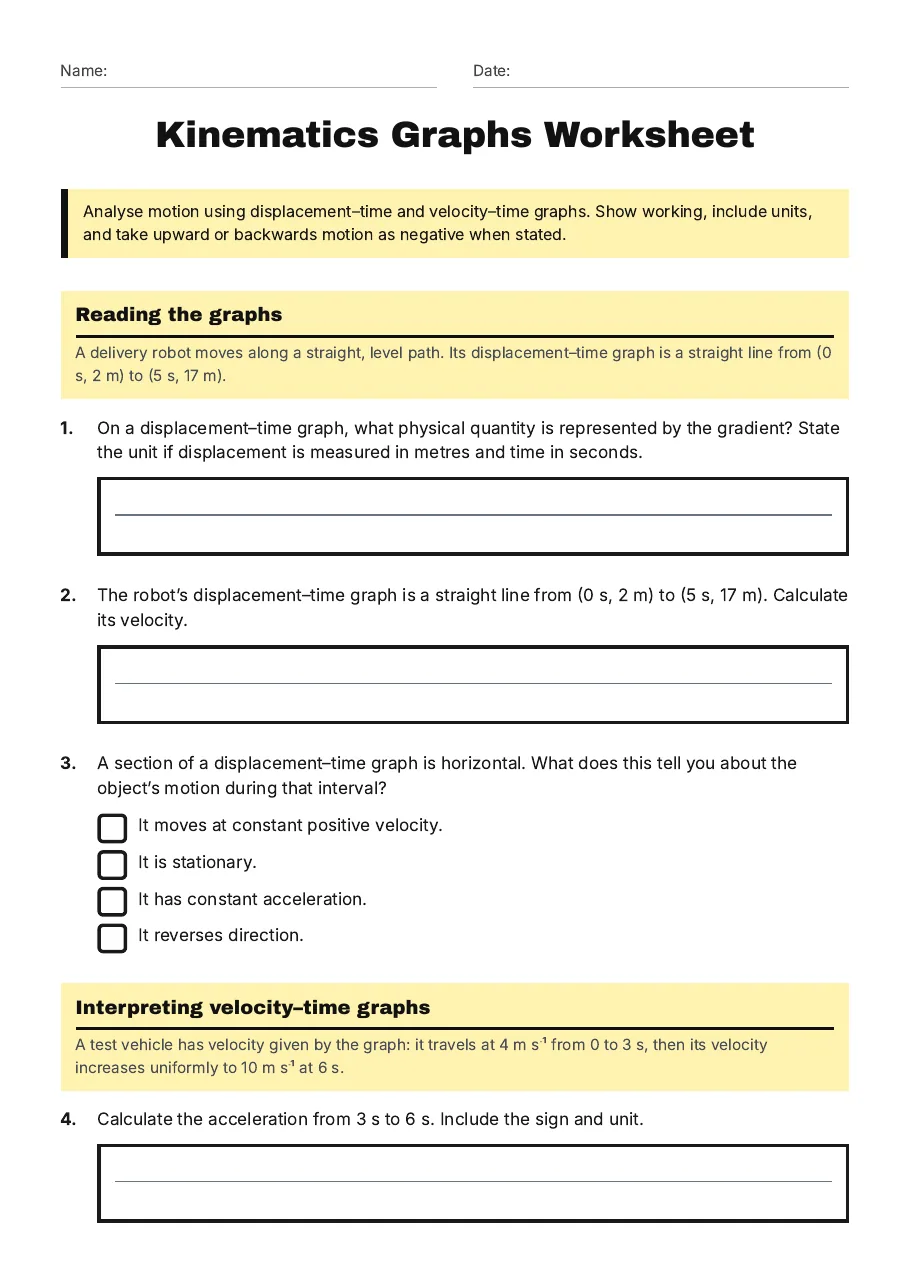
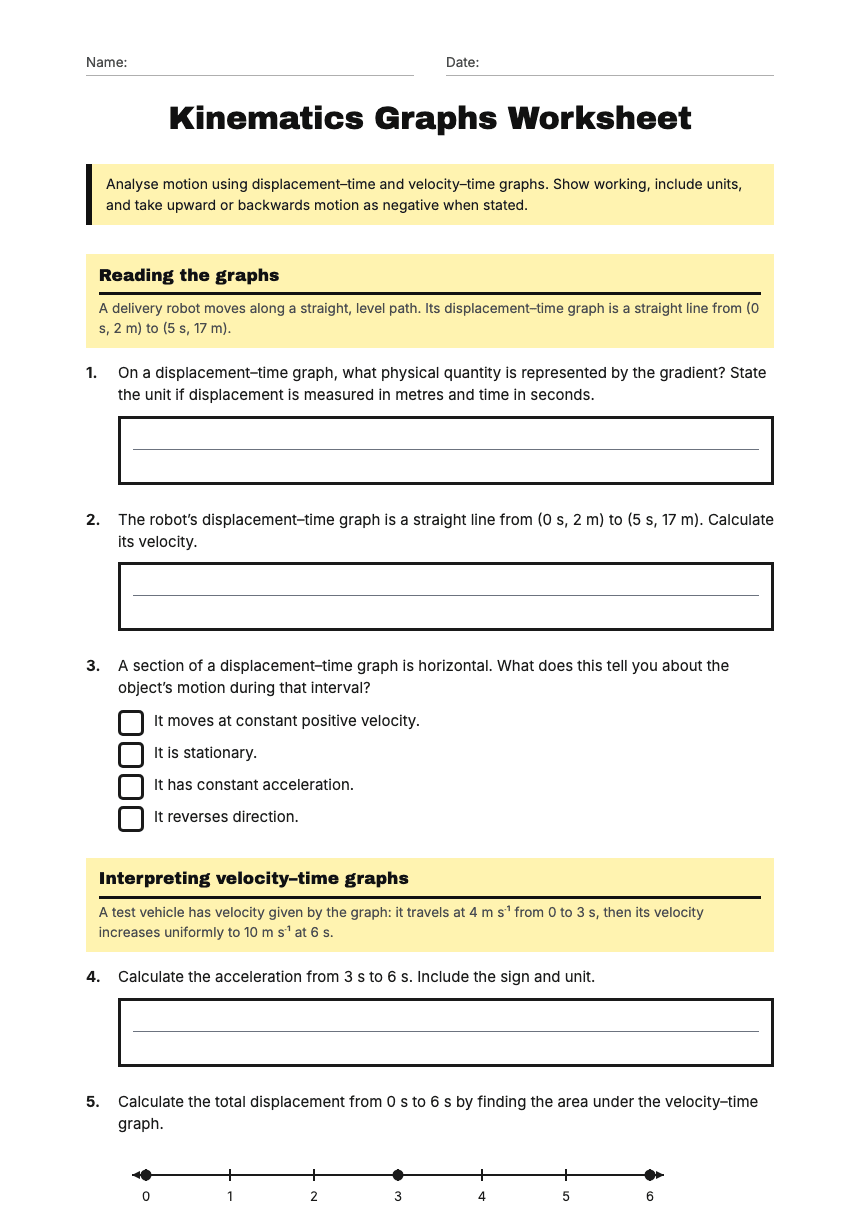
Kinematics Graphs Worksheet

Analyse motion using displacement–time and velocity–time graphs. Show working, include units, and take upward or backwards motion as negative when stated.

Reading the graphs

A delivery robot moves along a straight, level path. Its displacement–time graph is a straight line from (0 s, 2 m) to (5 s, 17 m).

1.On a displacement–time graph, what physical quantity is represented by the gradient? State the unit if displacement is measured in metres and time in seconds.
2.The robot’s displacement–time graph is a straight line from (0 s, 2 m) to (5 s, 17 m). Calculate its velocity.
3.A section of a displacement–time graph is horizontal. What does this tell you about the object’s motion during that interval?
  • It moves at constant positive velocity.
  • It is stationary.
  • It has constant acceleration.
  • It reverses direction.

Interpreting velocity–time graphs

A test vehicle has velocity given by the graph: it travels at 4 m s⁻¹ from 0 to 3 s, then its velocity increases uniformly to 10 m s⁻¹ at 6 s.

4.Calculate the acceleration from 3 s to 6 s. Include the sign and unit.
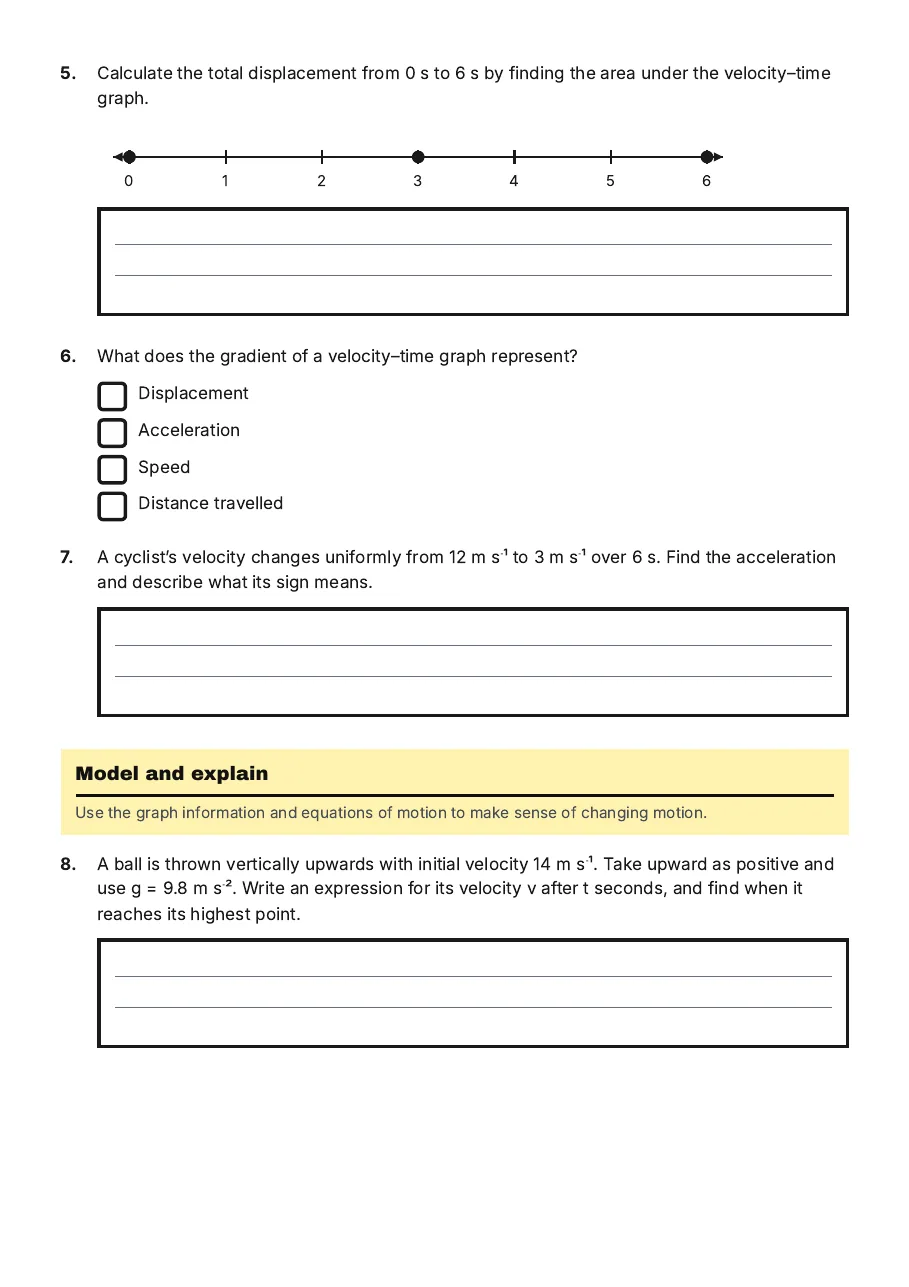
5.Calculate the total displacement from 0 s to 6 s by finding the area under the velocity–time graph.
0123456
6.What does the gradient of a velocity–time graph represent?
  • Displacement
  • Acceleration
  • Speed
  • Distance travelled
7.A cyclist’s velocity changes uniformly from 12 m s⁻¹ to 3 m s⁻¹ over 6 s. Find the acceleration and describe what its sign means.

Model and explain

Use the graph information and equations of motion to make sense of changing motion.

8.A ball is thrown vertically upwards with initial velocity 14 m s⁻¹. Take upward as positive and use g = 9.8 m s⁻². Write an expression for its velocity v after t seconds, and find when it reaches its highest point.
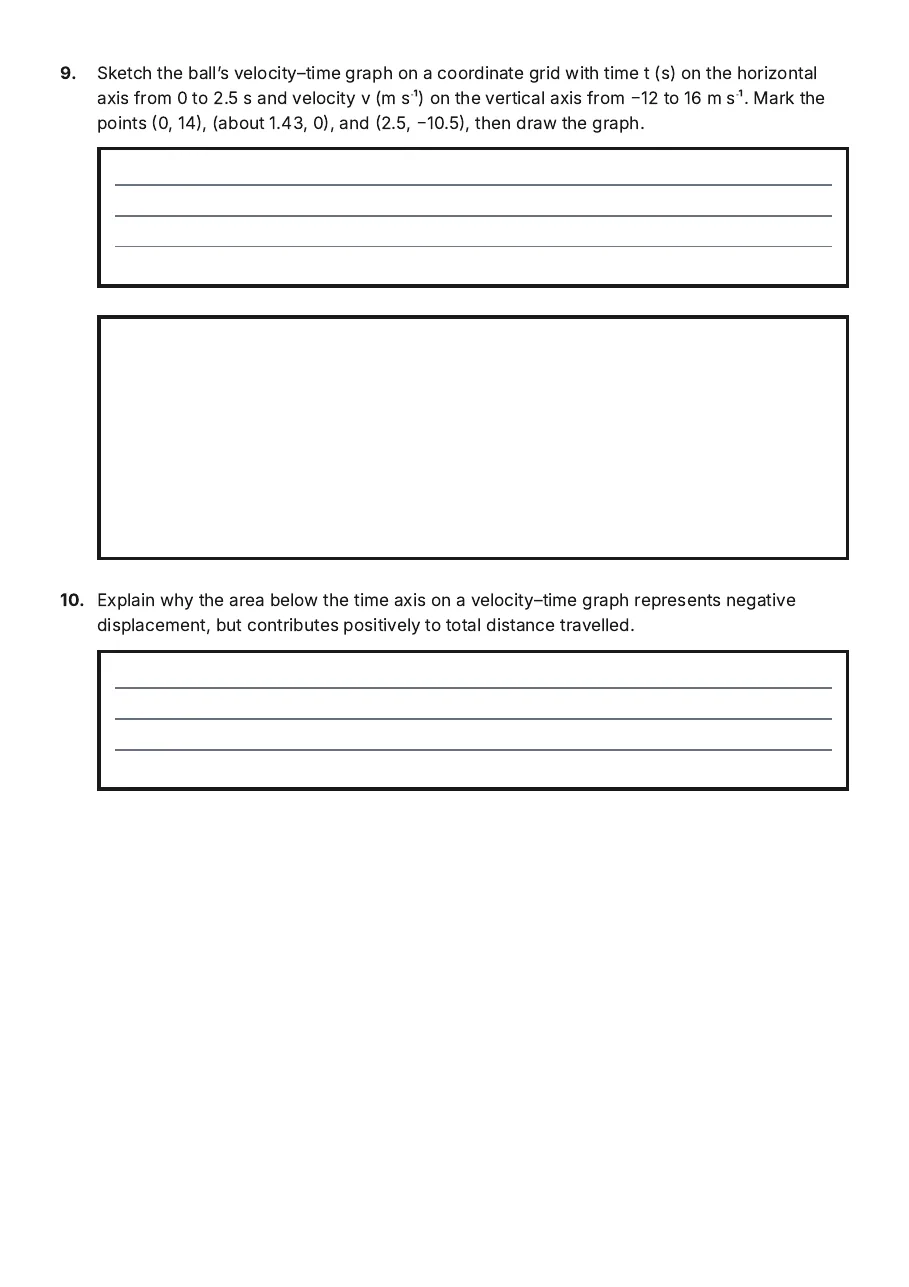
9.Sketch the ball’s velocity–time graph on a coordinate grid with time t (s) on the horizontal axis from 0 to 2.5 s and velocity v (m s⁻¹) on the vertical axis from −12 to 16 m s⁻¹. Mark the points (0, 14), (about 1.43, 0), and (2.5, −10.5), then draw the graph.
10.Explain why the area below the time axis on a velocity–time graph represents negative displacement, but contributes positively to total distance travelled.

3 printable pages

  • Kinematics Graphs Worksheet, page 1 of 3: Reading the graphs, Interpreting velocity–time graphs

    Page 1

  • Kinematics Graphs Worksheet, page 2 of 3: Model and explain

    Page 2

  • Kinematics Graphs Worksheet, page 3 of 3: 9. Sketch the ball’s velocity–time graph on a coordinate grid with time t (s) on the…

    Page 3

About This Worksheet

Free in Kuraplan

Sign up free, grab the PDF, and customize it for your class.

Print-Ready

Formatted for standard paper. Clean layout, easy to read.

AI-Generated

Created with Kuraplan's AI, designed for real classroom use.

For Teachers & Parents

Use in classrooms, for homework, tutoring, or homeschool.

Need a custom version of this worksheet?

Kuraplan's AI generates custom worksheets in seconds — differentiated for every learner, aligned to your curriculum.

Generate Custom Worksheets — Free
No credit card Curriculum-aligned Under 60 seconds