MathsFreePrintable
First Derivative Test Classification
A free maths worksheet ready for your classroom. Open in Kuraplan to grab the print-ready PDF, customize it for your students, or generate a fresh version in seconds.
Name:Date:
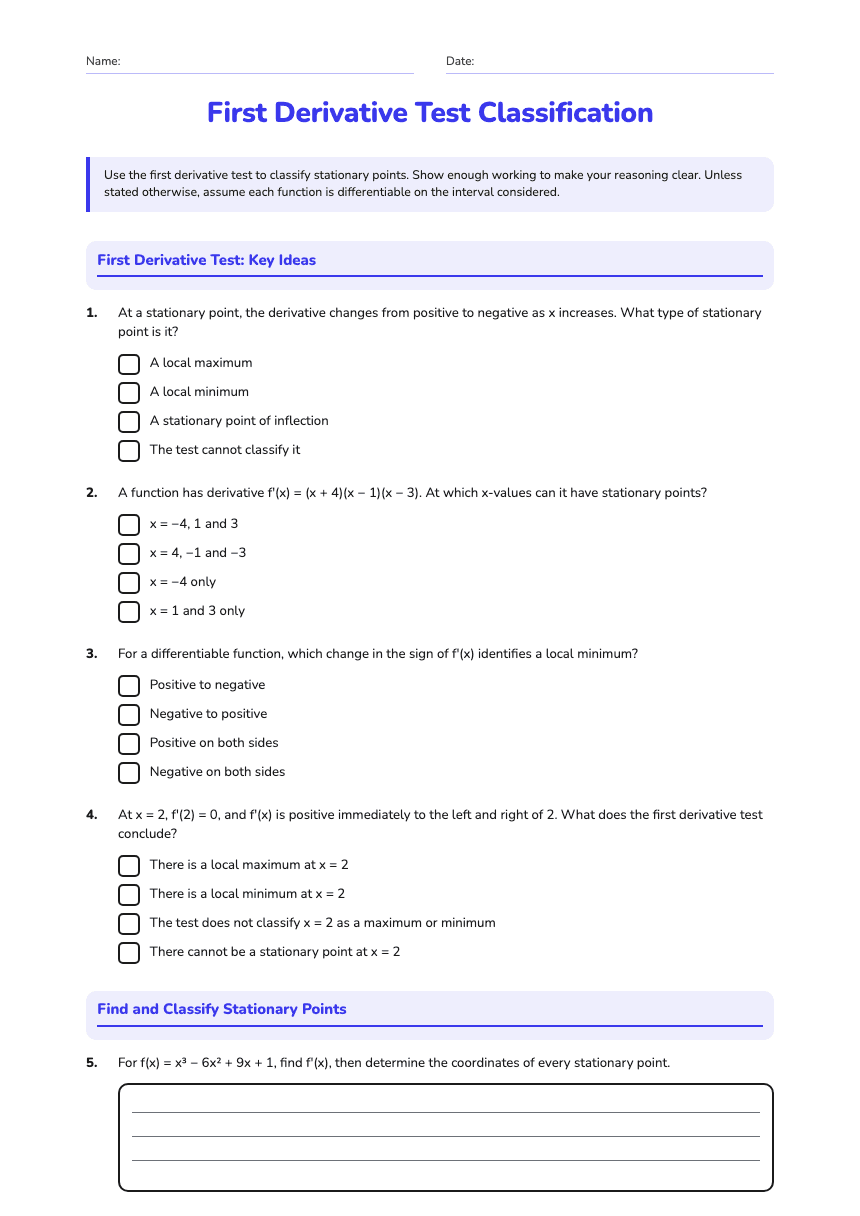
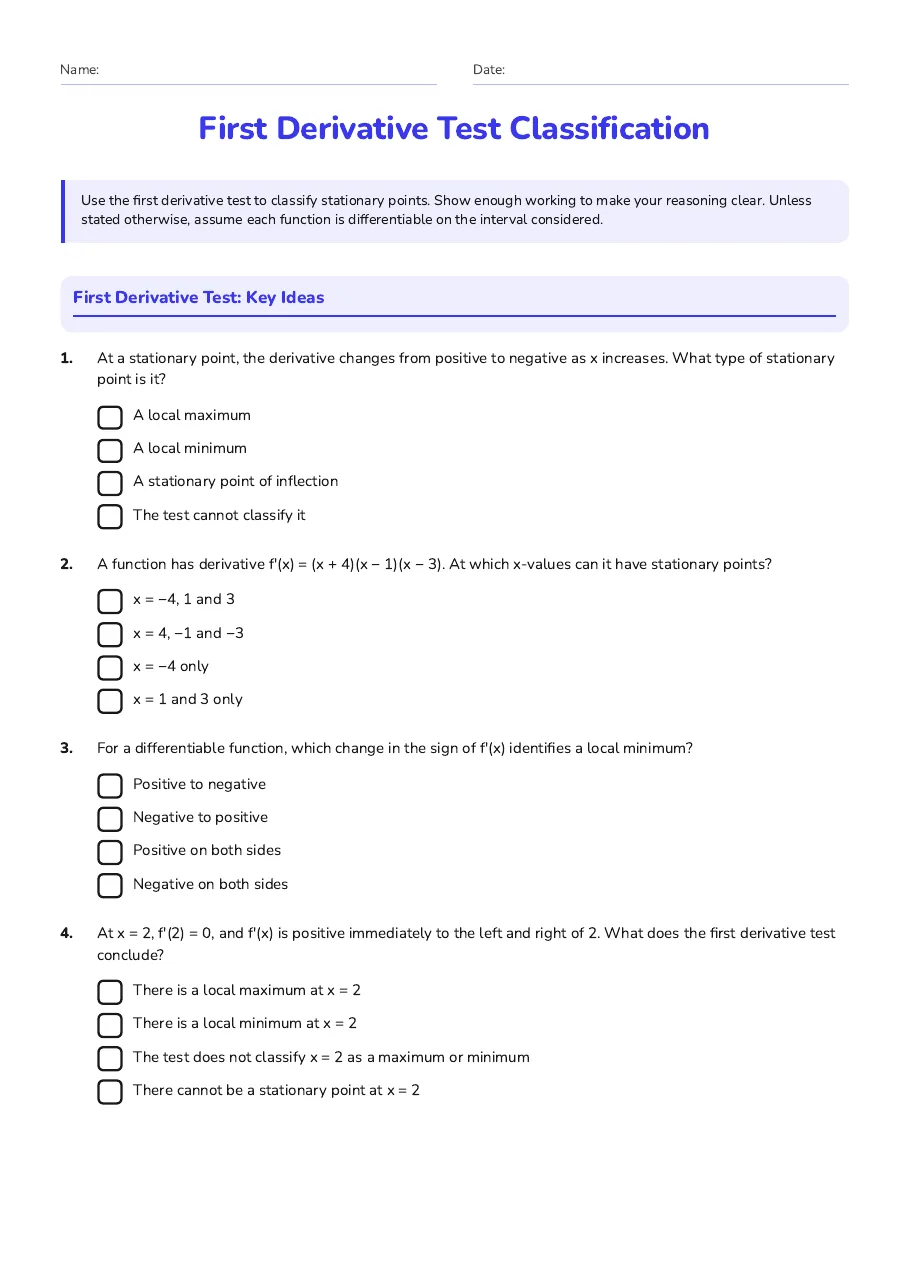
First Derivative Test Classification
Use the first derivative test to classify stationary points. Show enough working to make your reasoning clear. Unless stated otherwise, assume each function is differentiable on the interval considered.
First Derivative Test: Key Ideas
1.At a stationary point, the derivative changes from positive to negative as x increases. What type of stationary point is it?
- A local maximum
- A local minimum
- A stationary point of inflection
- The test cannot classify it
2.A function has derivative f′(x) = (x + 4)(x − 1)(x − 3). At which x-values can it have stationary points?
- x = −4, 1 and 3
- x = 4, −1 and −3
- x = −4 only
- x = 1 and 3 only
3.For a differentiable function, which change in the sign of f′(x) identifies a local minimum?
- Positive to negative
- Negative to positive
- Positive on both sides
- Negative on both sides
4.At x = 2, f′(2) = 0, and f′(x) is positive immediately to the left and right of 2. What does the first derivative test conclude?
- There is a local maximum at x = 2
- There is a local minimum at x = 2
- The test does not classify x = 2 as a maximum or minimum
- There cannot be a stationary point at x = 2
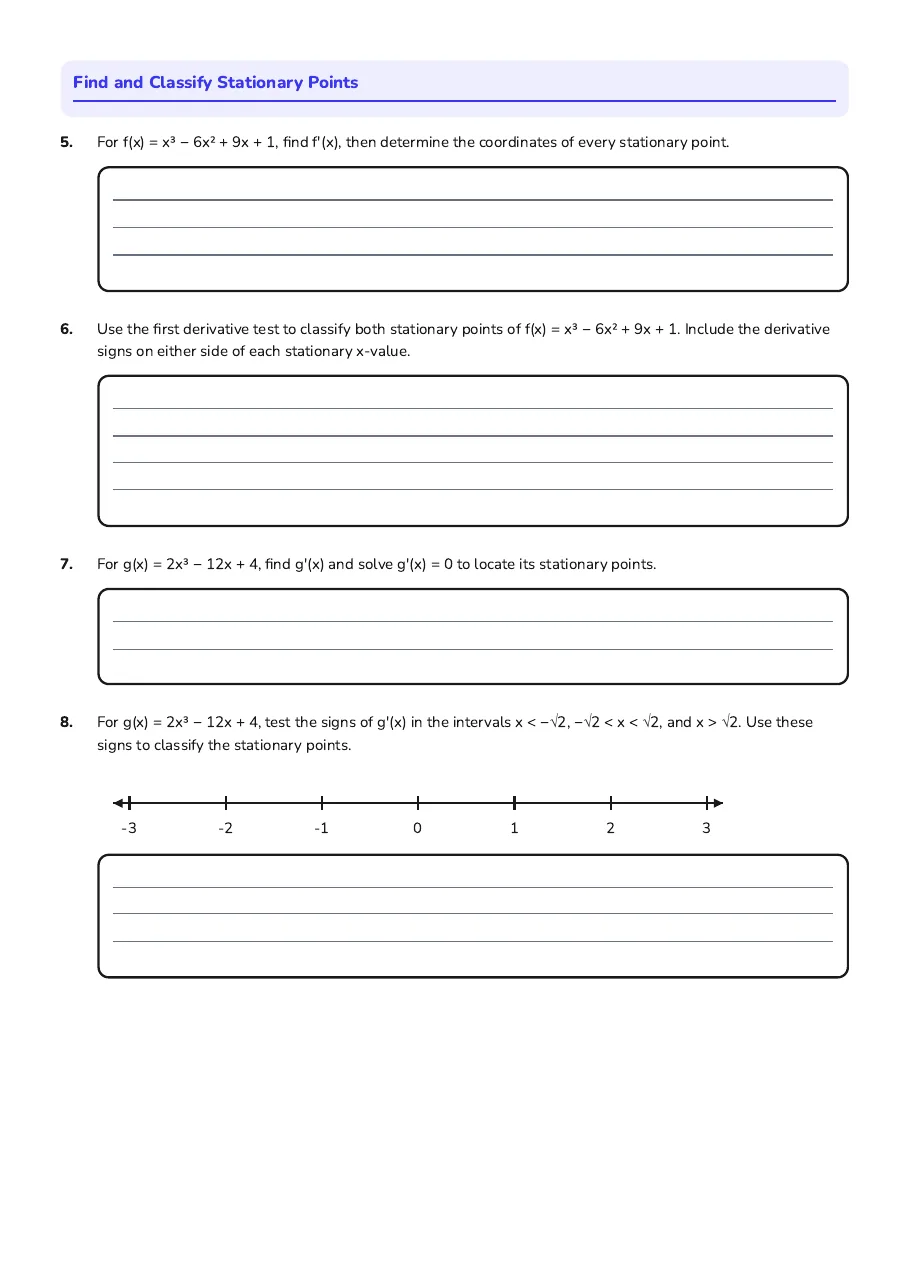
Find and Classify Stationary Points
5.For f(x) = x³ − 6x² + 9x + 1, find f′(x), then determine the coordinates of every stationary point.
6.Use the first derivative test to classify both stationary points of f(x) = x³ − 6x² + 9x + 1. Include the derivative signs on either side of each stationary x-value.
7.For g(x) = 2x³ − 12x + 4, find g′(x) and solve g′(x) = 0 to locate its stationary points.
8.For g(x) = 2x³ − 12x + 4, test the signs of g′(x) in the intervals x < −√2, −√2 < x < √2, and x > √2. Use these signs to classify the stationary points.
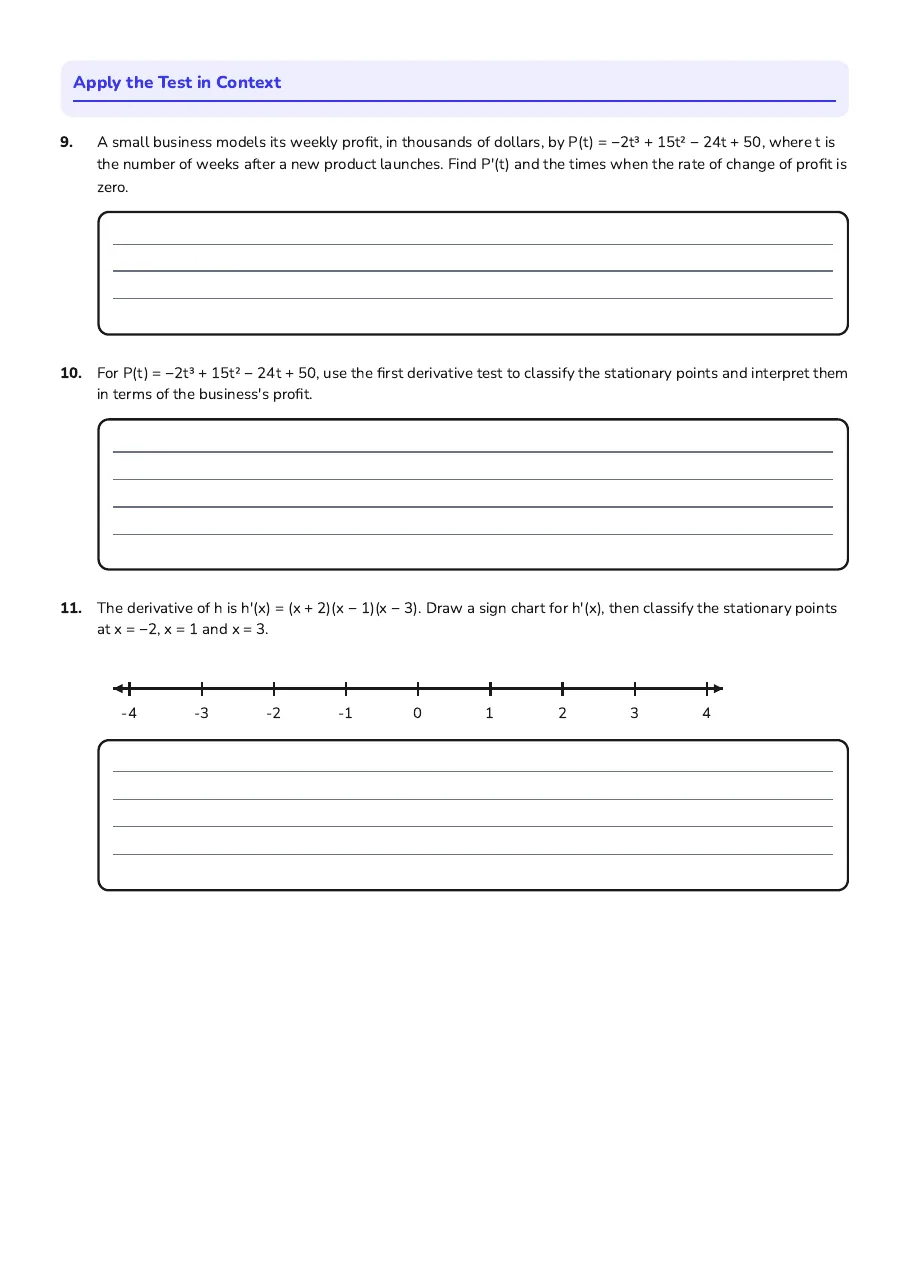
Apply the Test in Context
9.A small business models its weekly profit, in thousands of dollars, by P(t) = −2t³ + 15t² − 24t + 50, where t is the number of weeks after a new product launches. Find P′(t) and the times when the rate of change of profit is zero.
10.For P(t) = −2t³ + 15t² − 24t + 50, use the first derivative test to classify the stationary points and interpret them in terms of the business's profit.
11.The derivative of h is h′(x) = (x + 2)(x − 1)(x − 3). Draw a sign chart for h′(x), then classify the stationary points at x = −2, x = 1 and x = 3.
3 printable pages
Page 1
Page 2
Page 3
About This Worksheet
Free in Kuraplan
Sign up free, grab the PDF, and customize it for your class.
Print-Ready
Formatted for standard paper. Clean layout, easy to read.
AI-Generated
Created with Kuraplan's AI, designed for real classroom use.
For Teachers & Parents
Use in classrooms, for homework, tutoring, or homeschool.
Need a custom version of this worksheet?
Kuraplan's AI generates custom worksheets in seconds — differentiated for every learner, aligned to your curriculum.
Generate Custom Worksheets — Free No credit card Curriculum-aligned Under 60 seconds