Changing Nations Geography Test
A free social sciences worksheet ready for your classroom. Open in Kuraplan to grab the print-ready PDF, customize it for your students, or generate a fresh version in seconds.
Changing Nations Geography Test
📋 Learning Intention & Success Criteria
Learning Intention: To demonstrate understanding of how nations change over time through urbanisation, population growth, and development patterns.
Success Criteria: I can:
• Identify factors that cause population changes in nations
• Analyse data about urban population growth
• Explain how planned cities like Canberra develop
• Apply geographical knowledge to real-world examples
📚 Part A: Multiple Choice Questions
Choose the BEST answer for each question. Circle the letter.
📊 Part B: Data Analysis
Study this data about Australia's urban population growth:
Year 1950: 69% urban | Year 1980: 86% urban | Year 2020: 88% urban
🏛️ Part C: Case Study - Canberra
Read: Canberra was designed in 1912 by Walter Burley Griffin as Australia's capital city. It was planned to include government buildings, residential areas, parks, and a artificial lake. The city was designed in a circular pattern with the Parliament House at the centre.
About This Worksheet
Free in Kuraplan
Sign up free, grab the PDF, and customize it for your class.
Print-Ready
Formatted for standard paper. Clean layout, easy to read.
AI-Generated
Created with Kuraplan's AI, designed for real classroom use.
For Teachers & Parents
Use in classrooms, for homework, tutoring, or homeschool.
Need a custom version of this worksheet?
Kuraplan's AI generates custom worksheets in seconds — differentiated for every learner, aligned to your curriculum.
Generate Custom Worksheets — FreeMore Social Sciences Worksheets
Bird Migration Investigation
Free
Bird Migration: King Island & Tasmania
Free
City Liveability Ranking
Free
Island Map Explorer Mission
Free
South Africa Geography Map
Free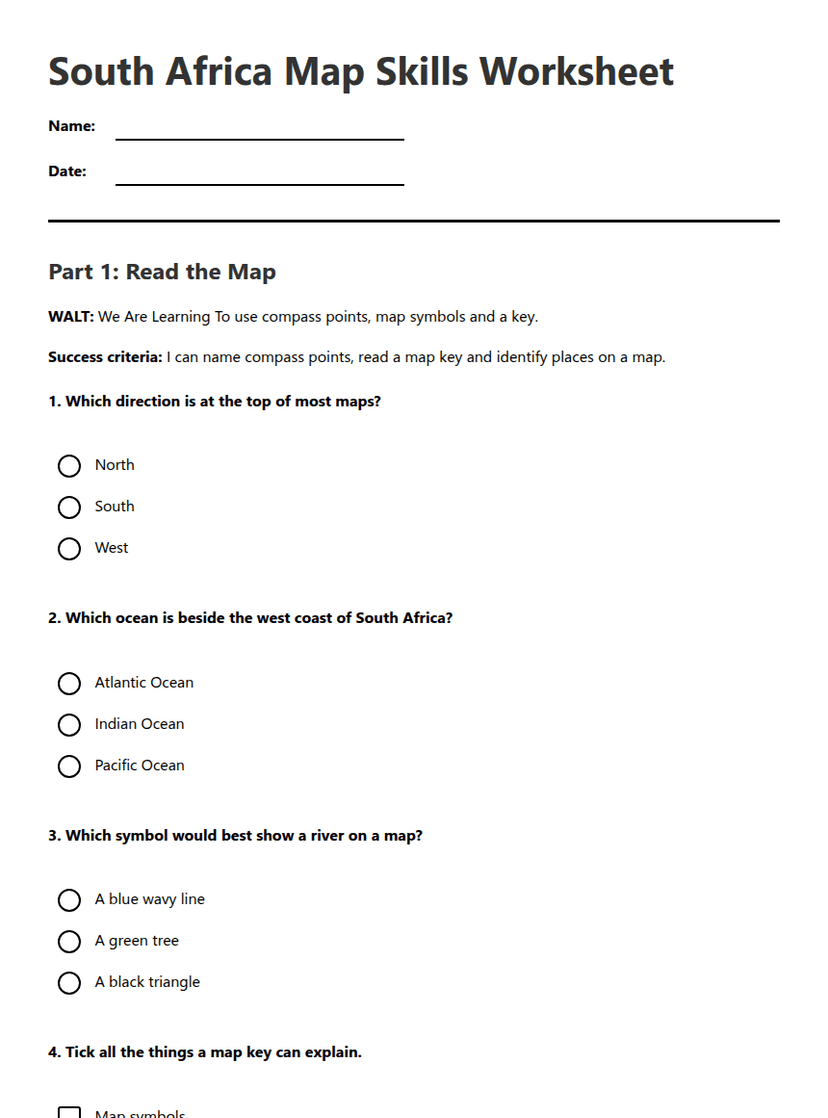
South Africa Map Skills Worksheet
Free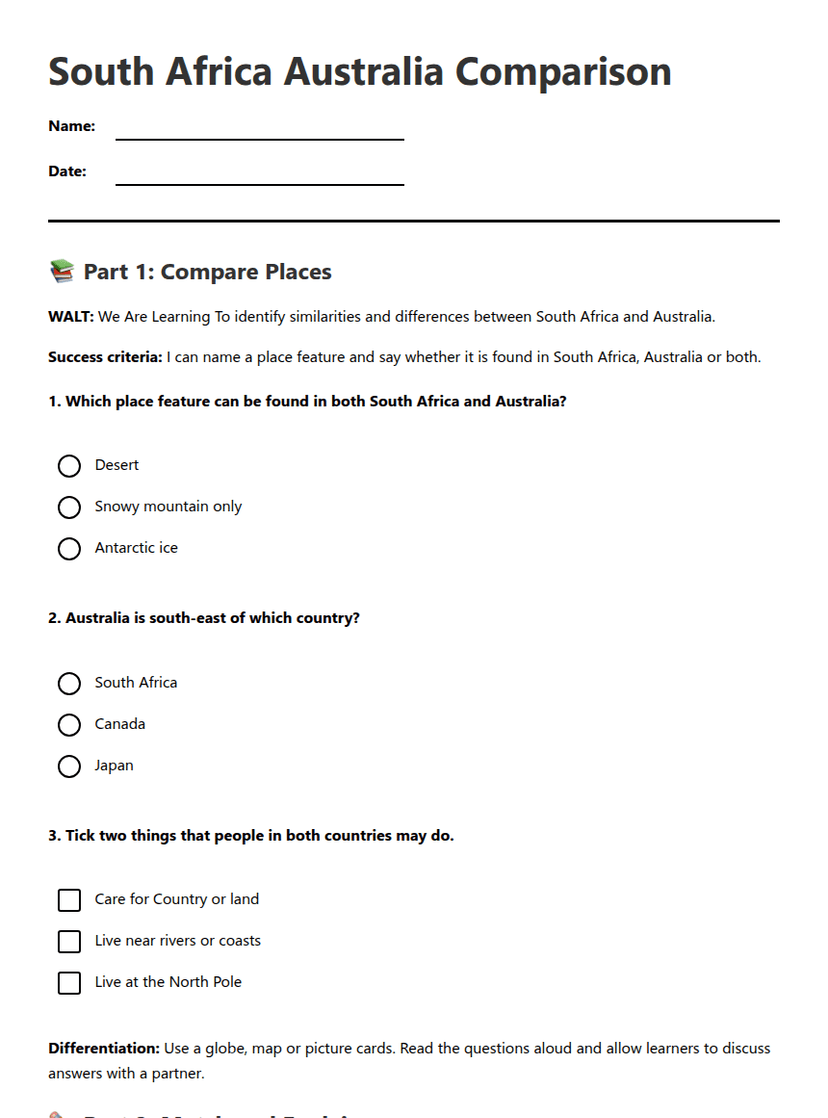
South Africa Australia Comparison
Free