Chemical Reaction Graphing
A free science worksheet ready for your classroom. Open in Kuraplan to grab the print-ready PDF, customize it for your students, or generate a fresh version in seconds.

Chemical Reaction Graphing
📊 Part 1: Graph Types and Chemical Reactions
📈 Part 2: Interpreting Chemical Reaction Graphs
Data: 20°C: 2.5 mL/min, 30°C: 4.2 mL/min, 40°C: 7.1 mL/min, 50°C: 11.8 mL/min, 60°C: 18.5 mL/min
🔬 Part 3: Analysing Your Experimental Data
🎯 Part 4: Graph Analysis and Predictions
____________ involves finding values within the range of your data, while ____________ involves predicting values beyond your data range. ____________ is generally more reliable because ____________.
A best fit line should pass through every data point:
True FalseOutliers should always be ignored when drawing conclusions:
True FalseThe scale on both axes must start at zero:
True FalseAbout This Worksheet
Free in Kuraplan
Sign up free, grab the PDF, and customize it for your class.
Print-Ready
Formatted for standard paper. Clean layout, easy to read.
AI-Generated
Created with Kuraplan's AI, designed for real classroom use.
For Teachers & Parents
Use in classrooms, for homework, tutoring, or homeschool.
Need a custom version of this worksheet?
Kuraplan's AI generates custom worksheets in seconds — differentiated for every learner, aligned to your curriculum.
Generate Custom Worksheets — FreeMore Science Worksheets
Atomic Theory Research Worksheet
Free
Physical and Chemical Changes
Free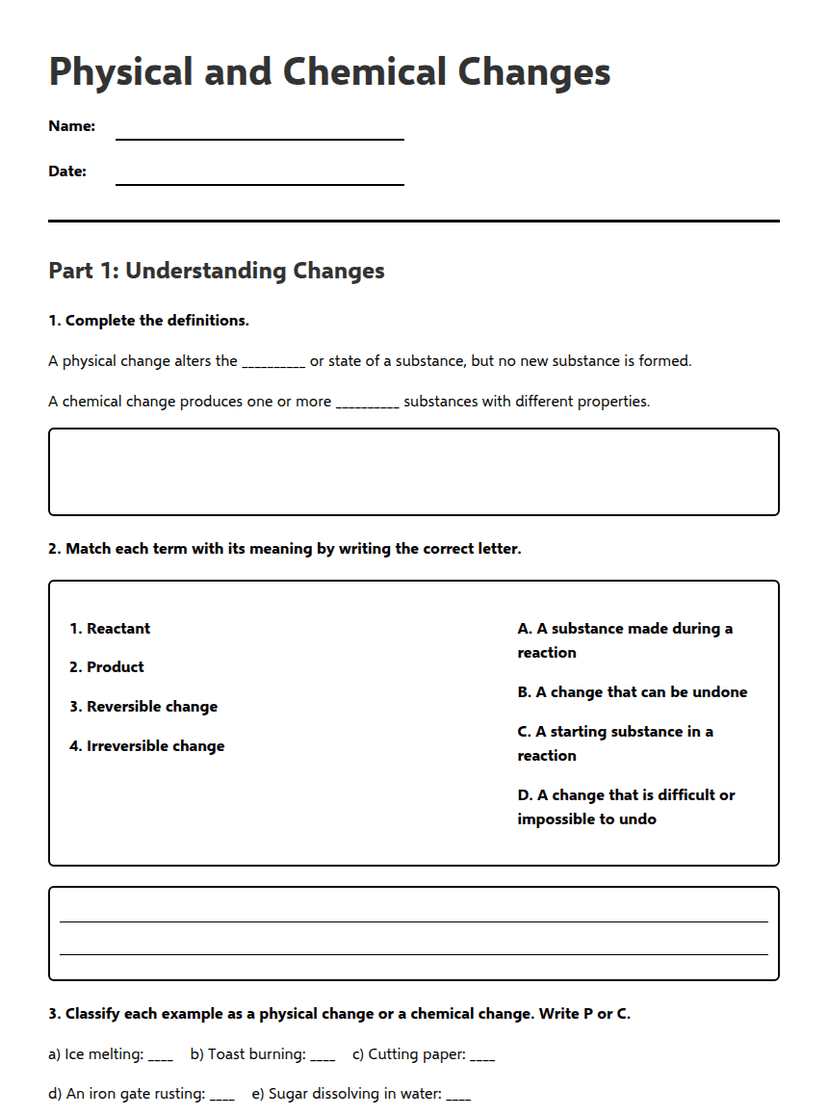
Physical and Chemical Changes
Free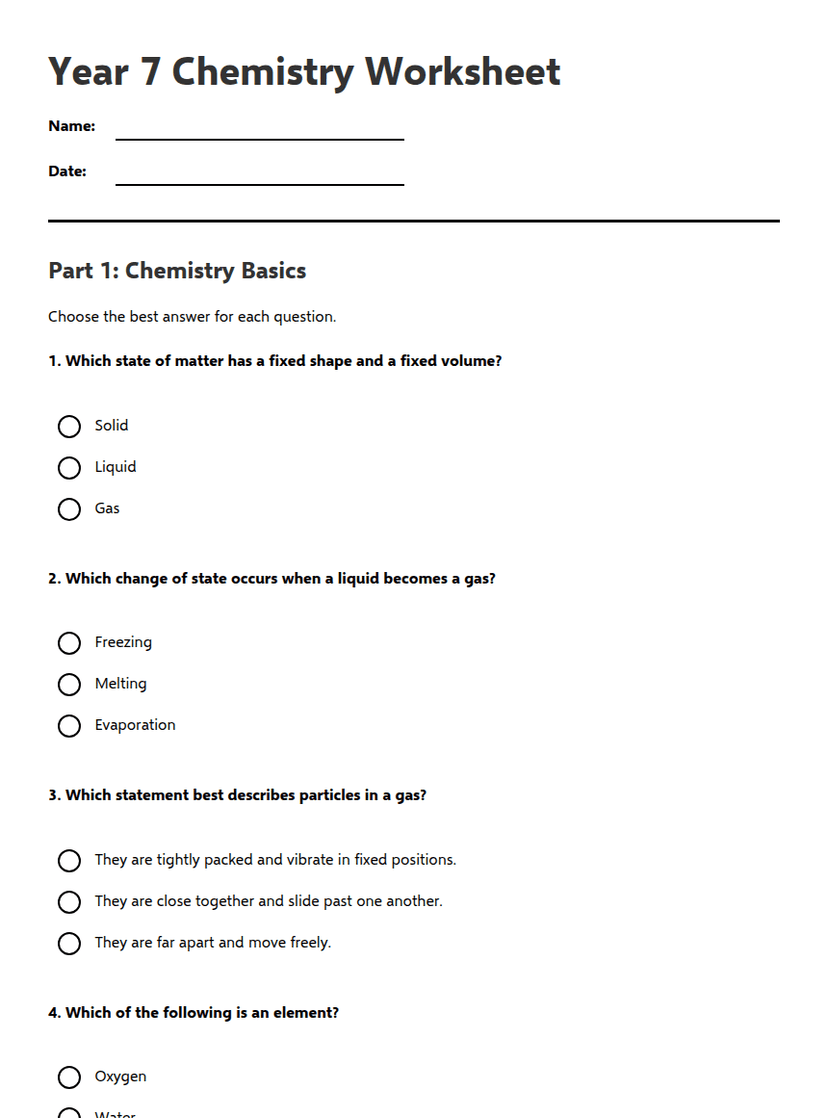
Year 7 Chemistry Worksheet
Free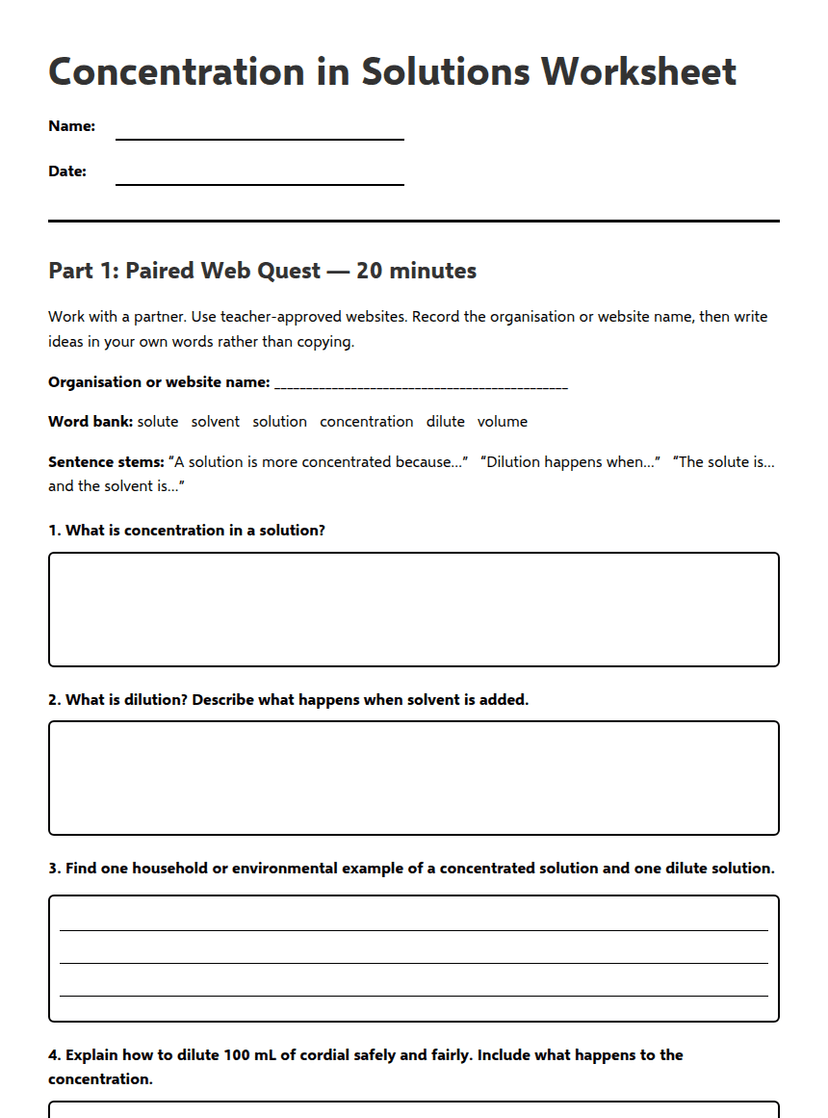
Concentration in Solutions Worksheet
Free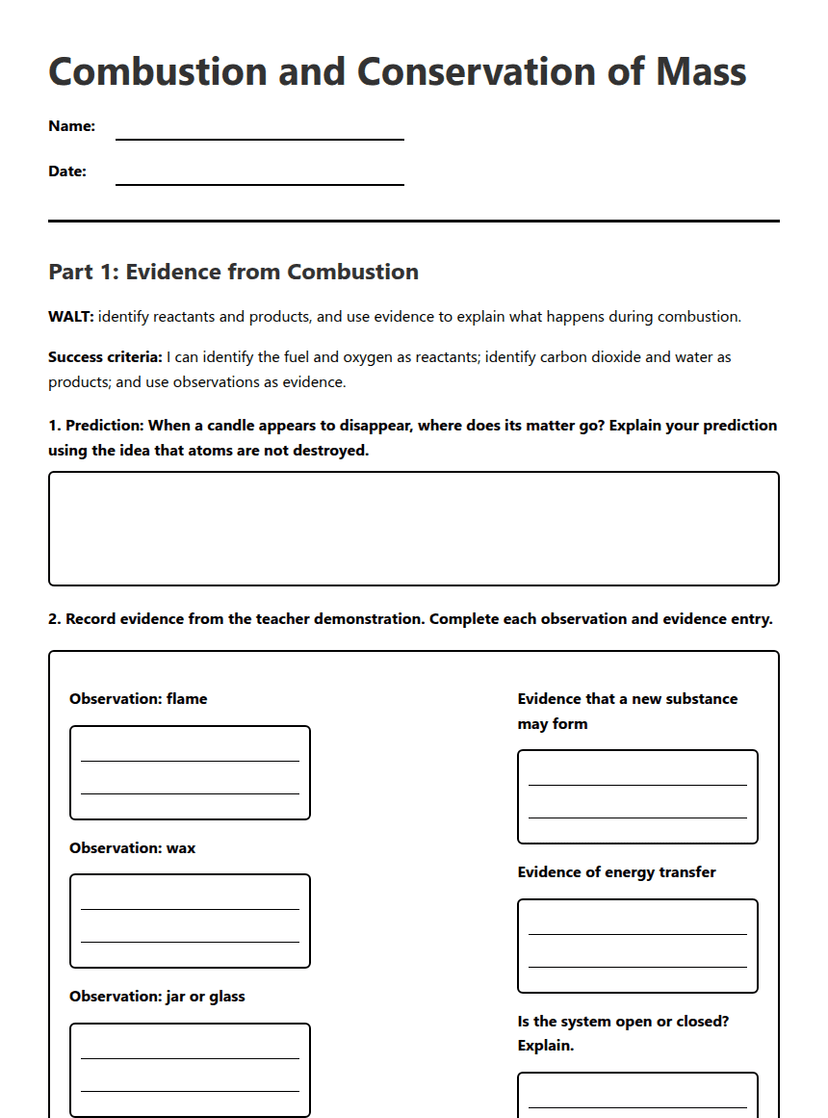
Combustion and Conservation of Mass
Free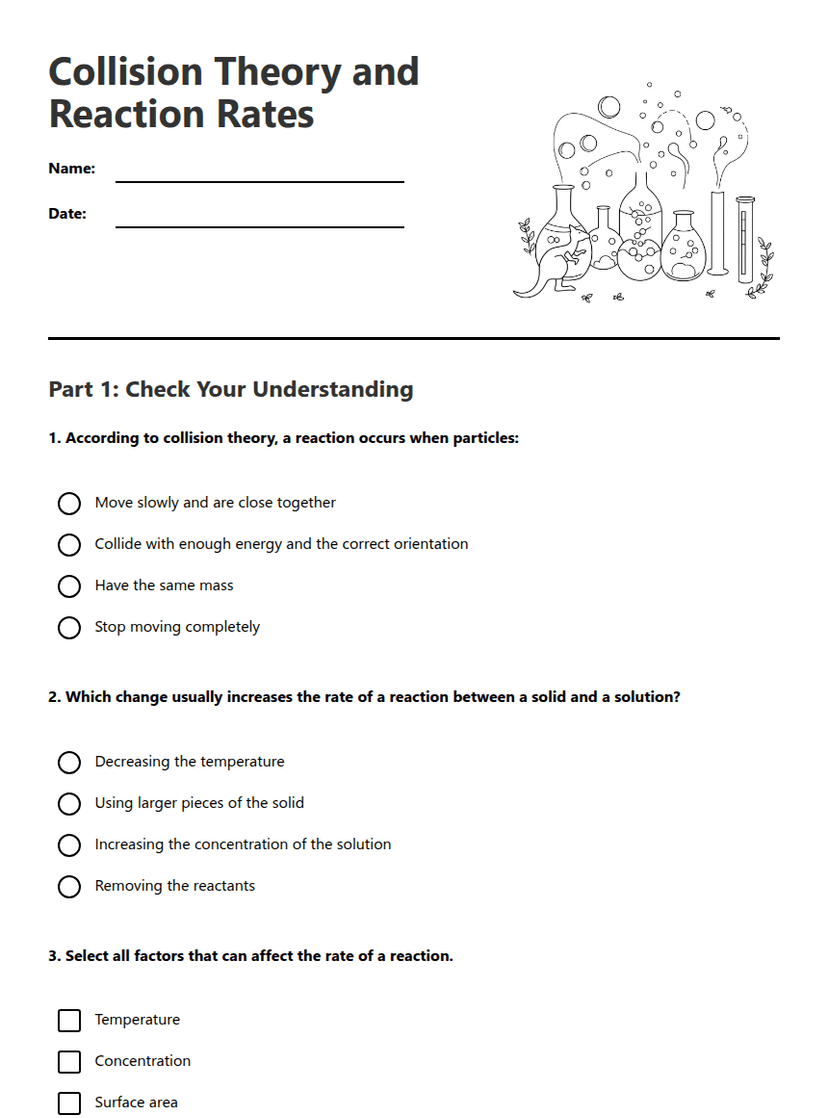
Collision Theory and Reaction Rates
Free