MathsFreePrintable

Distribution Shapes Identification Worksheet

A free maths worksheet ready for your classroom. Open in Kuraplan to grab the print-ready PDF, customize it for your students, or generate a fresh version in seconds.

Distribution Shapes Identification Worksheet worksheet preview
Distribution Shapes Identification Worksheet

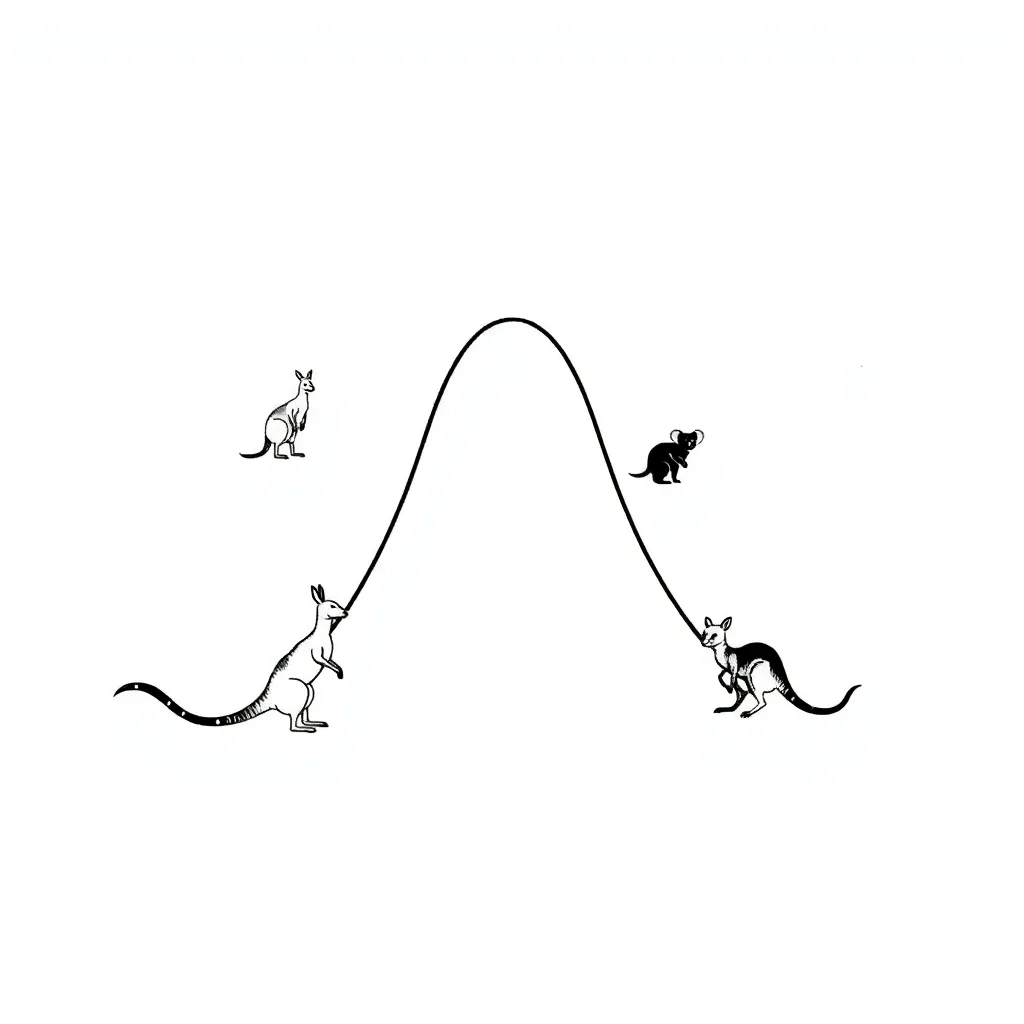
Statistical distribution graphs

📊 Part 1: Distribution Types - Multiple Choice

1. A symmetric distribution is one where:

The mean is greater than the median

The left and right sides are mirror images

Most data is concentrated on the right side

The tail extends to the left

2. In a positively skewed distribution:

The tail extends to the left

The mean equals the median

The tail extends to the right

Data is evenly distributed

3. Which statement is true for a negatively skewed distribution?

Mean > Median > Mode

Mode > Median > Mean

Mean = Median = Mode

Median > Mean > Mode

4. The ages of people at a children's birthday party would most likely show:

Symmetric distribution

Positive skew

Negative skew

Uniform distribution

📈 Part 2: Graph Analysis

5. Imagine a histogram showing house prices in Sydney. Most houses cost between $800,000-$1,200,000, but some luxury homes cost over $5,000,000. What type of distribution would this create?
6. A teacher records test scores for her Year 9 class. Most students scored between 70-85%, a few scored below 60%, and several scored above 90%. The distribution shows a long tail to the left. Identify the distribution type and explain your reasoning.
7. Complete the table by indicating the typical relationship between mean, median, and mode for each distribution type:

Symmetric: Mean _____ Median _____ Mode

Positively Skewed: _______ > _______ > _______

Negatively Skewed: _______ > _______ > _______

🎯 Part 3: Real-World Applications

8. For each scenario below, predict the most likely distribution shape and explain why:

a) Heights of adult males in Australia

b) Annual income of Australian workers

c) Age at retirement for Australian workers

9. A company's employee salaries show the following: most employees earn $50,000-$70,000, several managers earn $80,000-$120,000, and a few executives earn over $200,000. Draw a rough sketch of what this distribution might look like and label it.

About This Worksheet

Free in Kuraplan

Sign up free, grab the PDF, and customize it for your class.

Print-Ready

Formatted for standard paper. Clean layout, easy to read.

AI-Generated

Created with Kuraplan's AI, designed for real classroom use.

For Teachers & Parents

Use in classrooms, for homework, tutoring, or homeschool.

Need a custom version of this worksheet?

Kuraplan's AI generates custom worksheets in seconds — differentiated for every learner, aligned to your curriculum.

Generate Custom Worksheets — Free

No credit card Curriculum-aligned Under 60 seconds