You've got the poster on the wall, the steps are in the notebooks, and your students can recite them in order. Then you run a practical and half the class changes two things at once, records one trial, and writes a conclusion that just repeats what they hoped would happen. That's the familiar gap when figuring out how to teach scientific method well. Memorizing steps isn't the same as reasoning like a scientist.
The fix isn't a better poster. It's teaching the method as a set of reasoning moves you can model, practice, and assess separately. Can a student ask a testable question? Name what changed and what was measured? Cite specific data for a claim, and admit what the test couldn't show? When you score those moves on their own, you'll see exactly where a lesson stalls, and you'll know what to reteach next period instead of rerunning the whole experiment.
Match the Method to Each Grade Band
Most teachers aren't stuck on definitions. You're stuck on a simpler question: what can this class handle this term? Start there, and the planning gets easier.
That works better if you drop the idea of one fixed sequence. Scientists don't all run controlled lab tests. They observe, classify, build models, run fair tests, and design solutions, depending on the question. The National Academies chapter on science teaching misconceptions warns that students may view experiments as ways to reach expected results rather than test ideas, and that misconceptions can concern scientific methods themselves. So before you ask for a hypothesis, ask a better first question: What kind of evidence could answer this?
That one question changes the lesson. A question about which birds visit a feeder needs an observational study, not variables in beakers. A question about which material insulates best needs a fair test. A question about sorting rocks needs classification criteria. Students who can choose a method are already thinking scientifically, even before any equipment comes out.
What changes as students get older
The moves stay recognizable across K-12, but the independence and precision grow. Younger students need you to hold the structure while they notice and compare. Older students should be choosing controls, spotting confounds, and defending why their evidence is good enough.
| Grade band | Students design or do | Method emphasis | Teacher scaffold |
|---|---|---|---|
| K-2 | Ask questions, observe, sort and compare | Simple fair test with one changed factor | Picture question cards and teacher-recorded data |
| 3-5 | Name variables, measure, record in tables | Repeated trials and a control condition | Partly completed templates with a variable chart |
| 6-8 | Design controlled tests, graph results, state limits | Control groups, uncertainty and alternative explanations | Worked examples, then guided design briefs |
| 9-12 | Design independently, replicate, evaluate evidence quality | Confounding variables, observational and model-based methods | Peer critique and minimal scaffolds |
Read the table by what you're releasing. In K-2, you record the data because handwriting shouldn't block observation. In grades 3-5, students name variables and repeat trials, but the template still prompts them. In grades 6-8, worked examples come first, then design briefs with some choices already made. By 9-12, peer critique replaces your prompts, and students judge evidence quality for themselves.
A surprising result is useful data, not a failed experiment. Say that out loud in kindergarten and again in tenth grade.
Watch for one misconception at every age: students often believe an experiment exists to confirm the answer they expected. Counter it early and often. Ask, "What did the evidence show?" rather than, "Did it work?"
Pick the band by a plain test. You're at the right level if students can tell you, without looking at a sheet, what they changed and what they measured. If they can't say that, drop back a scaffold, no matter what their grade level says.
Set Objectives and Standards Before Planning the Unit
Choose the investigation last. First, write the objective for each lesson as something students will visibly do.
"Understand variables" won't help you plan or grade. Try this instead: Students will name the independent and dependent variables in a simple test and say how each one is measured. You can watch for that. You can score it on an exit ticket. A student either did it or didn't.
Then tag each objective to your district or state framework. Most frameworks separate planning investigations, analyzing data, and constructing explanations, and teachers using the Next Generation Science Standards can name the matching science and engineering practice for each lesson. That tagging keeps a unit from collapsing into one fun experiment with no progression. If you're clarifying how objectives become student-facing targets, this guide to learning intentions and success criteria lays out the wording shift.
Keep the unit narrow
Two or three objectives per unit is plenty. More than that and every lesson tries to teach everything, so nothing gets practiced twice.
- Check for reasoning: If students can meet an objective by following steps without explaining why, rewrite it. "Students will justify why a trial is fair" beats "Students will complete a fair test."
- Differentiate the objective, not just the worksheet: Stronger students can target controlling confounds and evaluating limits. Students still building vocabulary can target naming variables and recording measurements with units.
- Make success visible: Write the objective on the board in student language and return to it during the exit ticket.
That last habit matters more than it sounds. When students know the day's target is justifying a fair test, they stop asking whether their results match the textbook. They start checking their own designs before you do.
Run One Lesson From Phenomenon to Claim
One well-run lesson teaches more than three rushed ones. Use a phenomenon students can see, then walk through eight moves in order. Here's the shape of the lesson at a glance.
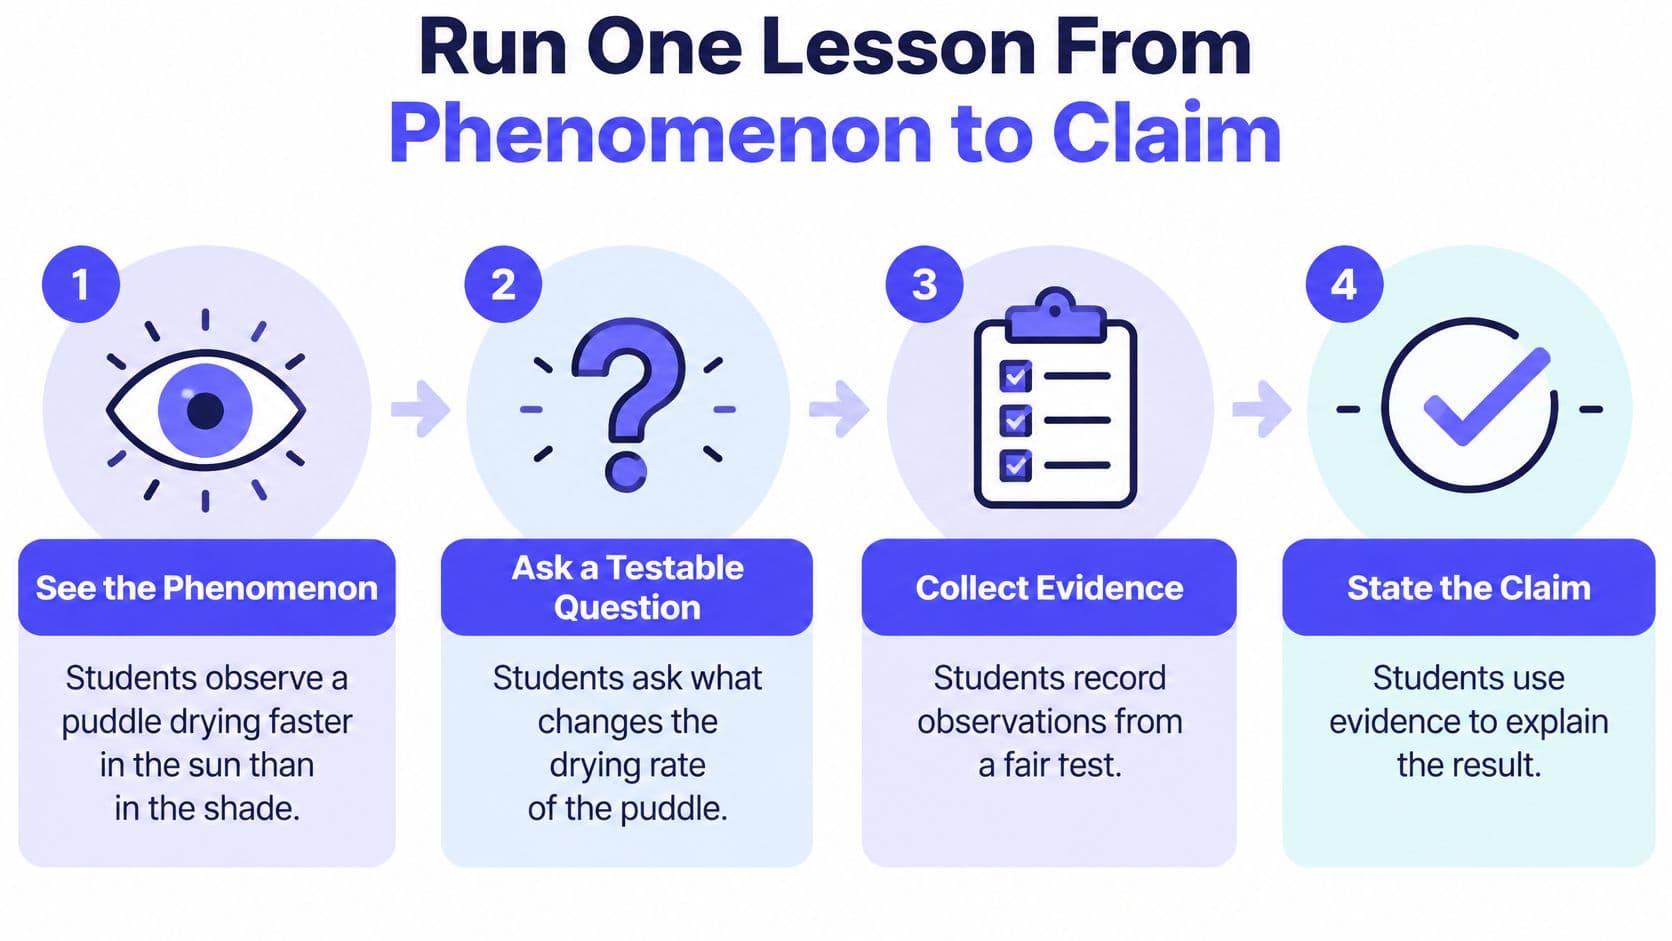
Say you show two puddles after recess, one in sun and one in shade. The sunny one is nearly gone. Now you have something real to explain.
- See the phenomenon. Ask what students notice and what they wonder. Don't explain evaporation yet. Curiosity gives the later steps a purpose.
- Write an investigable question. "Why does water disappear?" is too big to test. Coach it toward, "Does sunlight change how fast water evaporates?" A question students can't test leads nowhere.
- Name the variables before touching materials. Students identify what's manipulated, what responds, and what stays controlled. This is the step classes rush, and it's the one that decides whether the data mean anything.
- Predict with a mechanism. A guess isn't enough. Require a reason, such as, "The sunny dish will lose more water because warmth gives water particles more energy to escape." The mechanism is what later evidence will support or challenge.
- Design a fair test with repeated measurements. Same dishes, same starting volume, same time interval. Measure more than once so one odd reading doesn't become the conclusion.
- Represent the data. Students choose a table or graph that fits their measurements. Choosing the representation is itself a reasoning move, so don't always hand them a pre-drawn chart.
- Separate observation from interpretation. "The sunny dish lost 12 millilitres" is an observation. "Sunlight speeds evaporation" is an interpretation. Students who blur these will write claims their data can't support.
- Make a claim, name a limit, propose a follow-up. The claim cites specific numbers. The limit might be wind you didn't control. The follow-up test fixes that limit.
Model first, then release
Don't start with independent design. Model the whole cycle with a worked example while thinking aloud, then give partly completed templates, and only then ask students to design on their own. A synthesis in ERIC of 37 experimental and quasi-experimental studies found a mean learning effect of 0.50, while teacher-led inquiry conditions produced effects approximately 0.40 larger than student-led conditions. Unguided discovery feels student-centered, but the scaffolds are doing real work.
This is also where planning support helps. Kuraplan can turn those eight moves into a sequenced lesson with a matching worksheet and stage-by-stage prompts, so your prep time goes into the modeling rather than formatting. If your students need help staying active during the hands-on parts, a student's guide to hands-on learning from Zemith offers strategies they can apply themselves.
If you want a visual walkthrough before teaching it, this short video shows the cycle in action.
Teach Variables and Controls Before Any Experiment
Here's the error you'll see most: a group changes two things, gets a result, and can't tell you which change caused it. Teach variables as their own lesson, before any practical, and you'll prevent half your lab problems.
A fair test has three categories. The independent variable is the single factor you deliberately change. The dependent variable is the outcome you measure. Controlled variables are the conditions you keep constant. The Science Buddies variables guide uses a fertilizer example that works well on the board: fertilizer amount is independent, plant height after a defined period is dependent, and plant type, soil, pot size, water, light, and measurement schedule stay controlled.
Walk through what breaks if two factors change. Say a group adds fertilizer and moves their plant to a sunnier window. The plant grows taller. Which change did it? Nobody knows, and no amount of neat recording rescues that data. Younger students get the same logic with a faucet test: you can't change water pressure and how far the tap opens at the same time, then claim you know why the flow changed.
Practical rule: Don't accept a named variable without a measurement. "Plant growth" isn't measurable. "Height in centimetres after 14 days, measured from soil to tallest leaf" is.
A control group is not a controlled variable
This distinction trips up students well into high school. They'll call every unchanged factor "the control." Separate the two ideas explicitly. Controlled variables are conditions held constant across all trials. A control group is a comparison condition where the independent variable sits at its baseline.
Science Buddies guidance on experimental design for advanced projects explains that a negative control is expected to produce no positive result and helps reveal contamination or false positives, while a positive control is already known to produce a positive result and confirms the procedure can detect the effect. In the fertilizer test, untreated plants form the control group. They don't prove the hypothesis. They give you the baseline that makes the treated plants' growth readable.
Make students identify both on every design sheet:
- What stays constant: List each controlled variable and how you'll keep it constant.
- What provides the baseline: Name the control group and what it receives, or doesn't.
Sentence frames carry students who understand the idea but stall on writing it. "We will change ___ . We will measure ___ using ___ . We will keep ___ the same by ___ ." That one frame, used for a few weeks, produces cleaner designs than any vocabulary quiz.
Protocols, Design Pitfalls and Classroom Routines
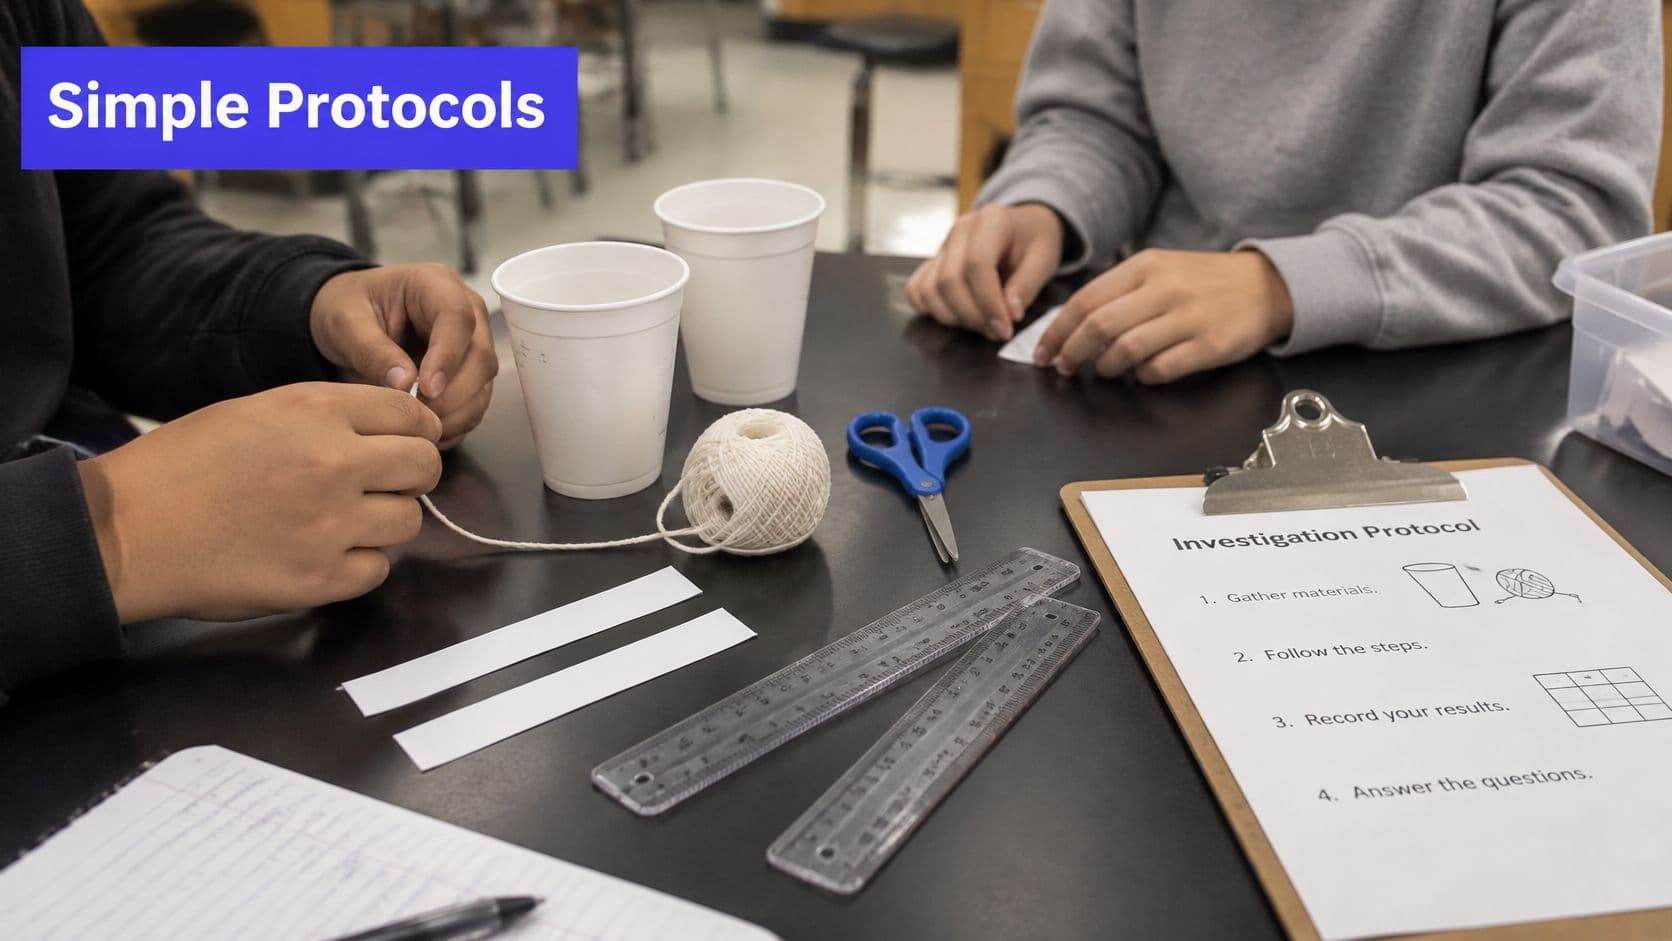
Good investigations share the same skeleton at every age: a question, named variables, short steps, a measurement method, and repeated trials. Only the complexity scales. This photo shows the kind of low-cost setup that works.
| Grade band | Investigation question | Variables | Measurement |
|---|---|---|---|
| K-2 | Which paper towel soaks up the most water? | Independent: towel brand. Dependent: millilitres absorbed in 30 seconds. Controlled: same cup and pour height | Measuring cup, read after each trial |
| 3-5 | Does ramp height change how far a toy car rolls? | Independent: ramp height. Dependent: distance rolled. Controlled: same car and floor surface | Metre stick, three runs averaged |
| 6-8 | Does water temperature change how fast sugar dissolves? | Independent: water temperature. Dependent: seconds to dissolve. Controlled: sugar mass and stirring rate | Timer, repeated three times |
| 9-12 | Does substrate concentration change catalase activity? | Independent: hydrogen peroxide concentration. Dependent: oxygen volume. Controlled: enzyme source, temperature and volume | Gas syringe reading, with controls and uncertainty recorded |
You can find ready structures like these among printable experiment worksheets and protocols, then adapt the variables to your materials.
Teach the errors before the practical
Before students collect data, show two designs side by side: one controlled, one confounded. Ask which variable differs, what interpretive problem that creates, and whether the evidence could support the claim. Then have students revise the flawed design and explain why the revision improves causal inference.
That explicit practice pays off. A meta-analysis in the International Journal of Science Education of 72 controlled-variable-skills intervention studies reported a mean effect size of 0.61. Treat design errors as diagnostic information, not grading failures. A student who changes two factors is showing you exactly what to teach next.
Run it as a progression: your think-aloud, small-group comparison, an individual design justification, the practical itself, then a transfer task in a new context. Score control of variables, recognition of alternative explanations, and justification, not whether students got the expected result.
Expect three recurring pitfalls. Students discard results that disagree with their prediction, so model a surprising result leading to a revised question. Students change two factors, so require a variable check before data collection starts. Students treat one trial as a finding, so set a repeat rule in advance and a documented rule for discarding any trial.
For routines, assign roles (materials, timer, recorder, speaker) and set cleanup expectations before anything comes out of the cupboard. Keep a running list of misconceptions on your desk copy. It's the cheapest planning tool you'll own.
Assess Reasoning Apart From Lab Completion
You've marked this report before. Every section is filled in, the graph is neat, and the conclusion sounds confident. Then you ask the student why the test was fair, and there's a long pause. Procedural completion hid weak reasoning, and the grade rewarded following instructions.
Score the reasoning moves separately so that can't happen. Understanding Science guidance for teacher educators notes that students do not automatically connect classroom activities with scientists' work, so teachers must explicitly highlight and assess those connections. That means assessing question quality, variable selection, measurement reliability, data representation, claim-evidence reasoning, uncertainty, alternative explanations, and revision after critique as distinct components.
| Criterion | Developing | Proficient |
|---|---|---|
| Question quality | Names a topic but cannot be tested | Names one variable and a measurable outcome |
| Variable control | Changes two factors or leaves some unnamed | Names all variables and explains how each is held constant |
| Measurement reliability | One trial, no units or inconsistent tools | Repeated trials, units and a stated tool for each measure |
| Data representation | Data copied without a labelled table or graph | Labelled table or graph chosen to fit the data |
| Claim and evidence | Claim restates the expected result | Claim cites specific data and states limits |
| Revision after critique | No change after feedback | Explains what changed and why it improves the inference |
Check during the lesson, not after it
Don't wait for the report. Right after groups set up their variables, ask three quick questions at each table:
- What changes: Point to it.
- What stays the same: Name two things and how you're holding them steady.
- How you'll measure: Which tool, which units, how many times?
Ninety seconds per group catches design flaws while they're still fixable. These formative assessment examples for in-lesson checks give you more formats for that mid-lesson window.
End with an exit ticket that asks which observation supports the claim, what evidence is still missing, and how the investigation could change. Allow oral explanations, drawings, labelled models, and sentence frames alongside writing. Multilingual learners, students with disabilities, and younger pupils can show strong reasoning long before they can produce a lengthy lab report, and you shouldn't mistake writing load for science understanding.
Build in peer critique, too. Groups swap designs, name one missing control, and revise. Score the revised version as well as the first draft, because revision after feedback is often where the strongest learning shows up. Finally, ask students to explain each rubric criterion in their own words. A student who can describe what proficient variable control looks like is far more likely to produce it next time.
Pick One Lesson and Run It This Week
Don't rebuild your whole science program on Monday. Pick one class and one lesson, and run it properly.
Use the grade-band expectations to choose the skill level, then commit to a single independent variable. That's your discipline for the week. Prepare three things the night before: the variable chart, a partly completed protocol, and the exit ticket. If you're building materials during class, you'll rush the modeling, and the modeling is the part that works.
Open with the phenomenon. Anything visible will do: ice melting on metal versus wood, a plant leaning toward the window, a paper plane that keeps veering left. Get questions and predictions written before any materials come out. Once the equipment's on the tables, nobody wants to stop and think about variables.
Then check designs table by table before anyone collects data. A group that can't point to its variable, name a control, and say how it will measure goes back to fix the design on the spot. It feels slower. It isn't, because you're not spending the last fifteen minutes untangling uninterpretable results.
Sort the exit tickets before you plan the next lesson. The piles tell you what to teach.
Make three piles. One for students who identified the variables cleanly. One for students who named the evidence behind their claim. One for students still confusing observation with interpretation. That last pile is the most informative: if it's tall, your next lesson needs more modeling, not a harder investigation. If the first two piles dominate, you're ready to release more design choices, like letting groups pick their own independent variable.
Run that cycle a few times and something shifts. Students start asking, "But what else changed?" without prompting. The method stops being a chart on the wall and becomes how your class argues about evidence. At that point, how to teach scientific method stops being a planning problem and starts being a classroom habit you've built, one checked design at a time.
Ready to run that first lesson without spending your evening on formatting? Kuraplan can help you draft standards-aligned science lessons, worksheets, and assessment rubrics in minutes, so you can spend your time on the modeling. Build your phenomenon-to-claim lesson there and adjust it to your students before class.