Industrial Revolution Timeline (1760–1840) (detailed) — free printable clipart
Free social_sciences resource for teachers · CC BY-NC 4.0
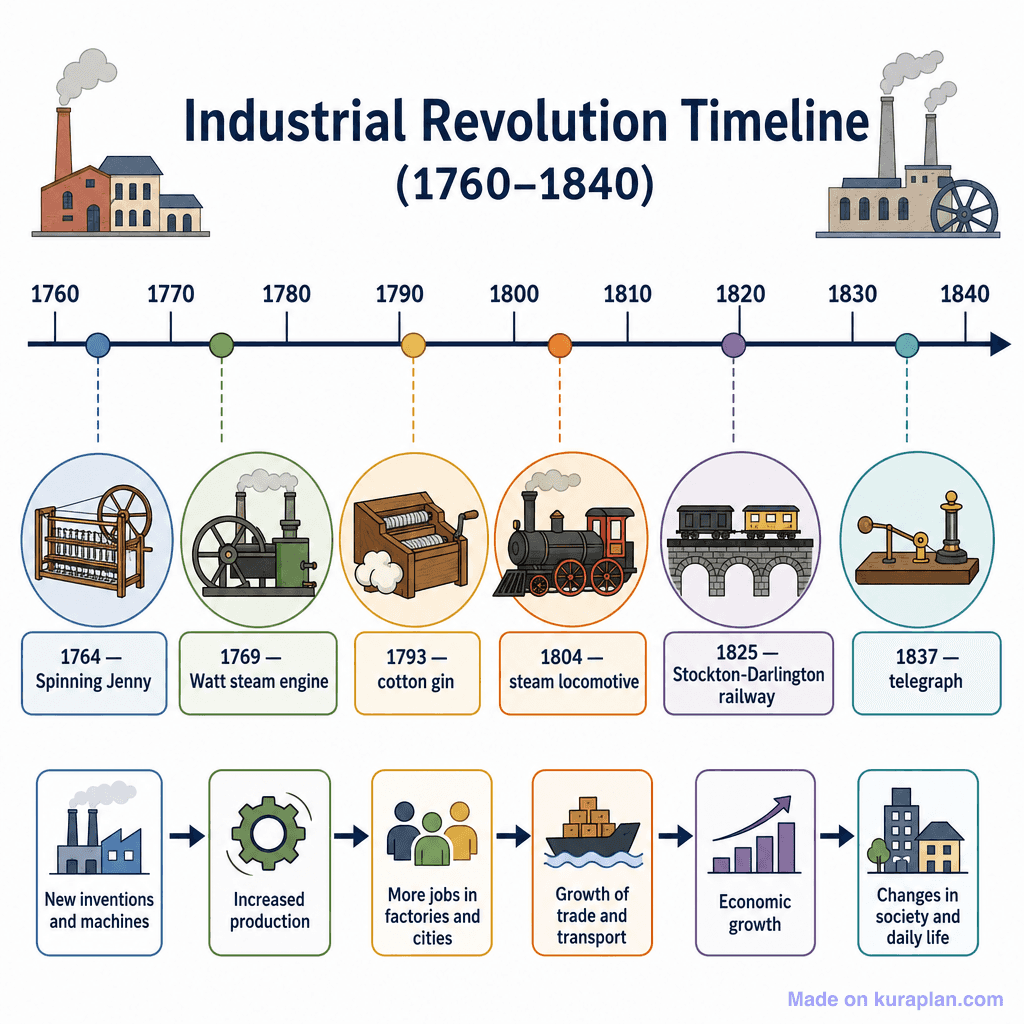
About this illustration
A detailed labeled timeline diagram of the Industrial Revolution (1760–1840) showing six key inventions/events plotted on a horizontal arrow timeline with decade markers. Each event is illustrated with a circular icon and a date-label box below. A second row of six sequential boxes with arrows shows the societal impact chain: new inventions → increased production → more jobs → growth of trade and transport → economic growth → changes in society and daily life. Factory illustrations appear in the top corners.
How to use
- 1Right-click the image and choose “Save image as”, or use the download button.
- 2Use it in your classroom worksheets, slides or printables — free under CC BY-NC 4.0.
- 3Attribute as “Image by Kuraplan” or link back to kuraplan.com. Not for commercial resale.
Make worksheets with images like this
Kuraplan's editor has the full image library built in — drag-and-drop into a worksheet in seconds.
Browse by subject
18 subjects · 5,619 free illustrations
Maths
1,895 free illustrations
Cross-Curricular
835 free illustrations
Science
816 free illustrations
English
612 free illustrations
Geography
549 free illustrations
Health
200 free illustrations
social_studies
177 free illustrations
Religious Education
139 free illustrations
Music
128 free illustrations
Art
66 free illustrations
Drama
56 free illustrations
History
47 free illustrations
arts
26 free illustrations
pe
25 free illustrations
te_reo_maori
24 free illustrations
tech
16 free illustrations
culture
7 free illustrations
languages
1 free illustrations