Environmental Change Investigation
A free science worksheet ready for your classroom. Open in Kuraplan to grab the print-ready PDF, customize it for your students, or generate a fresh version in seconds.
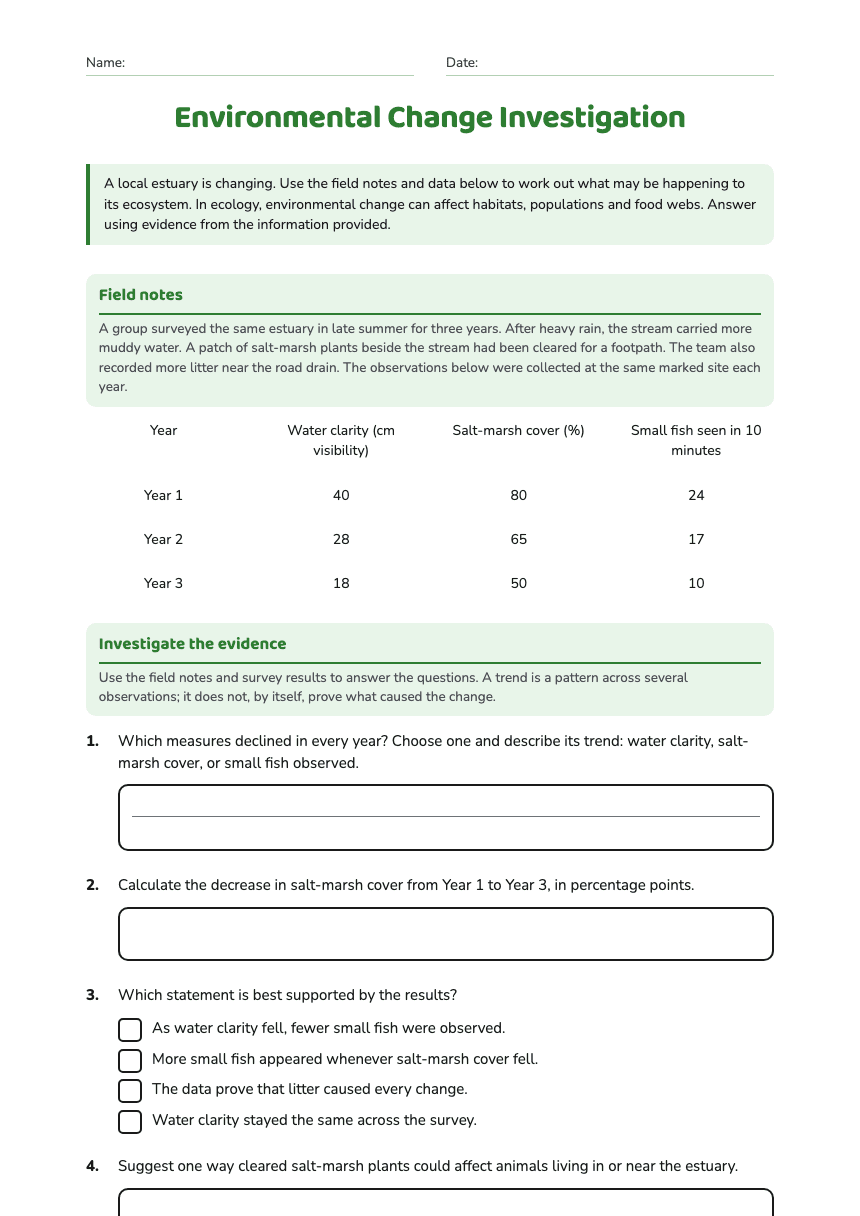
Environmental Change Investigation
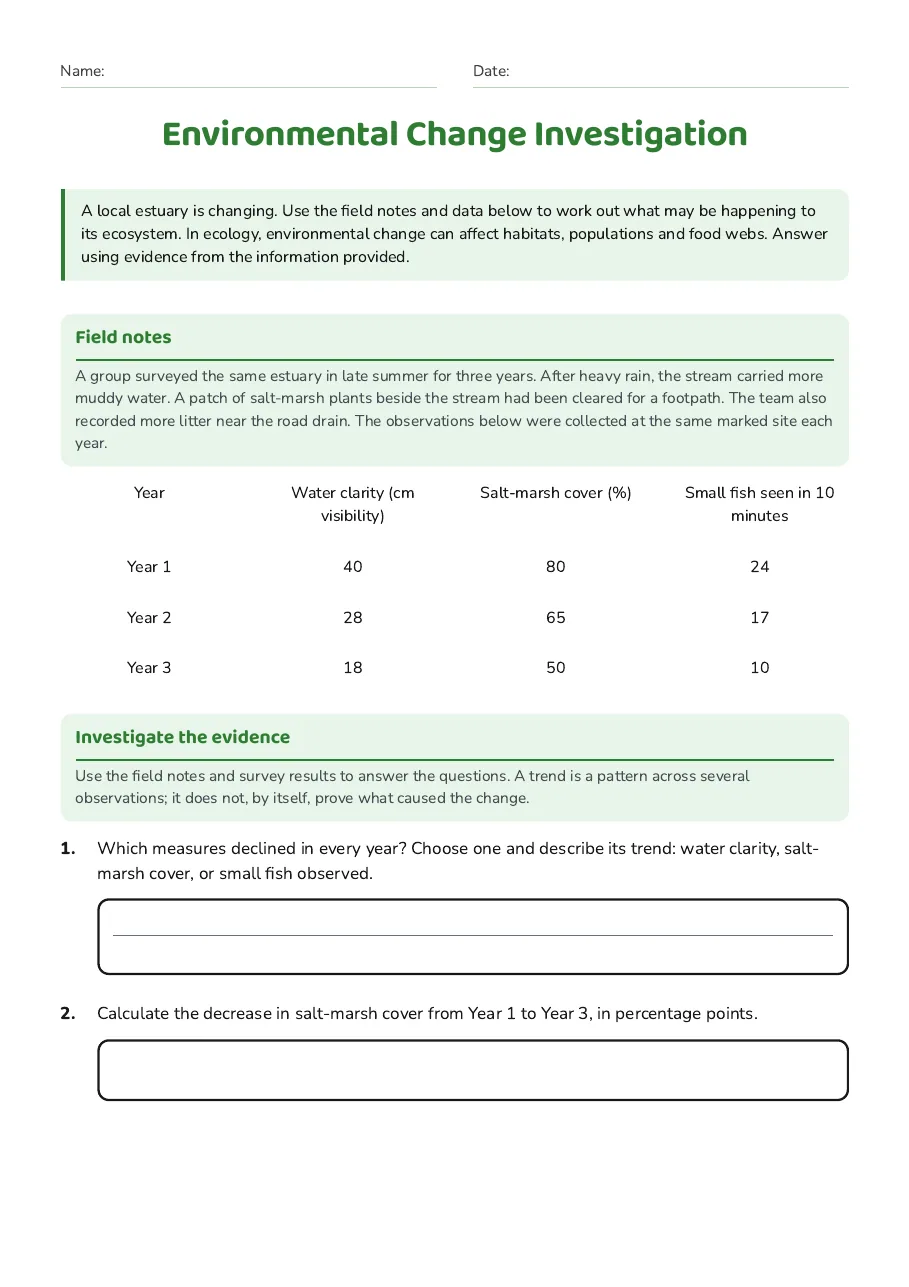
Field notes
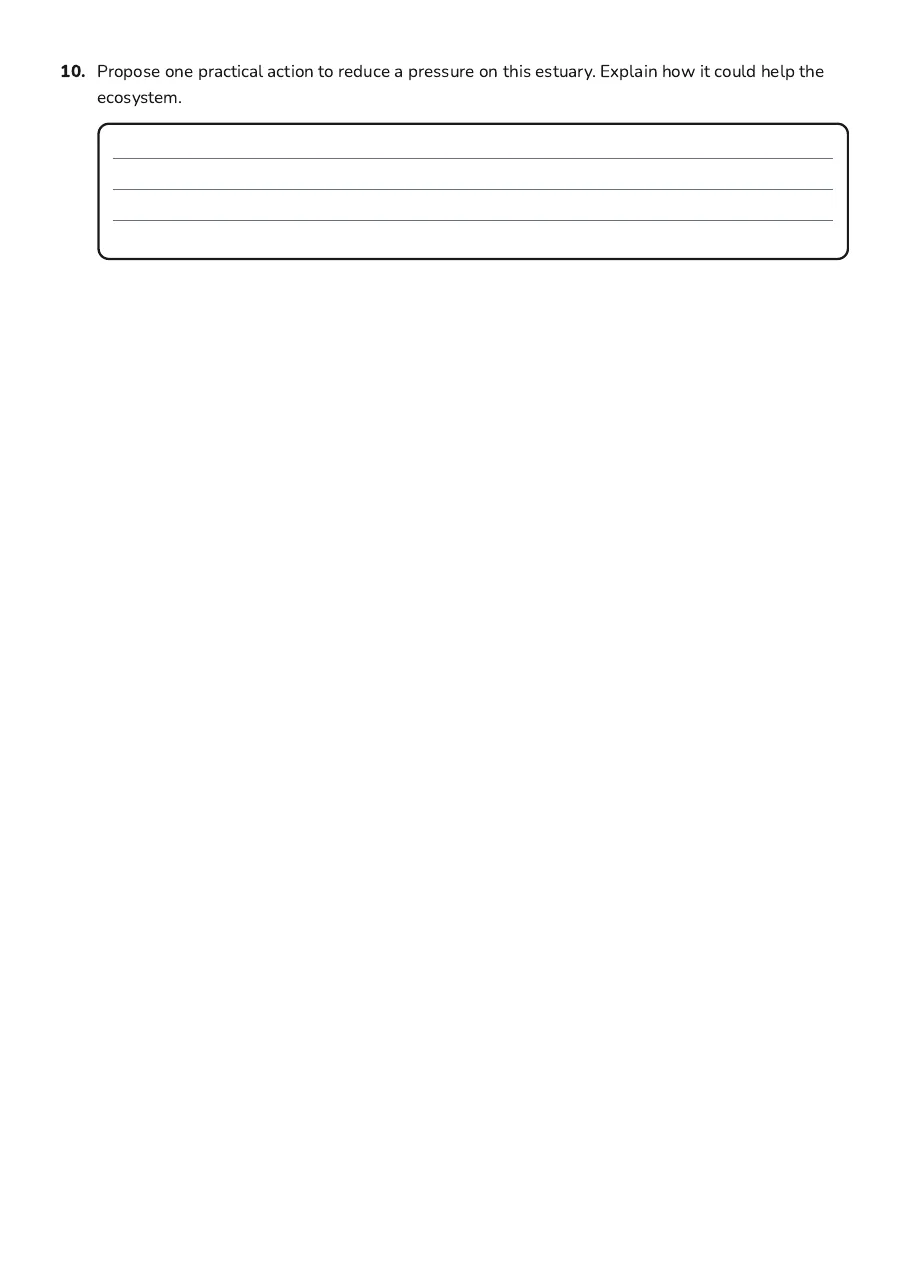
A group surveyed the same estuary in late summer for three years. After heavy rain, the stream carried more muddy water. A patch of salt-marsh plants beside the stream had been cleared for a footpath. The team also recorded more litter near the road drain. The observations below were collected at the same marked site each year.
Year
Water clarity (cm visibility)
Salt-marsh cover (%)
Small fish seen in 10 minutes
Year 1
40
80
24
Year 2
28
65
17
Year 3
18
50
10
Investigate the evidence
Use the field notes and survey results to answer the questions. A trend is a pattern across several observations; it does not, by itself, prove what caused the change.
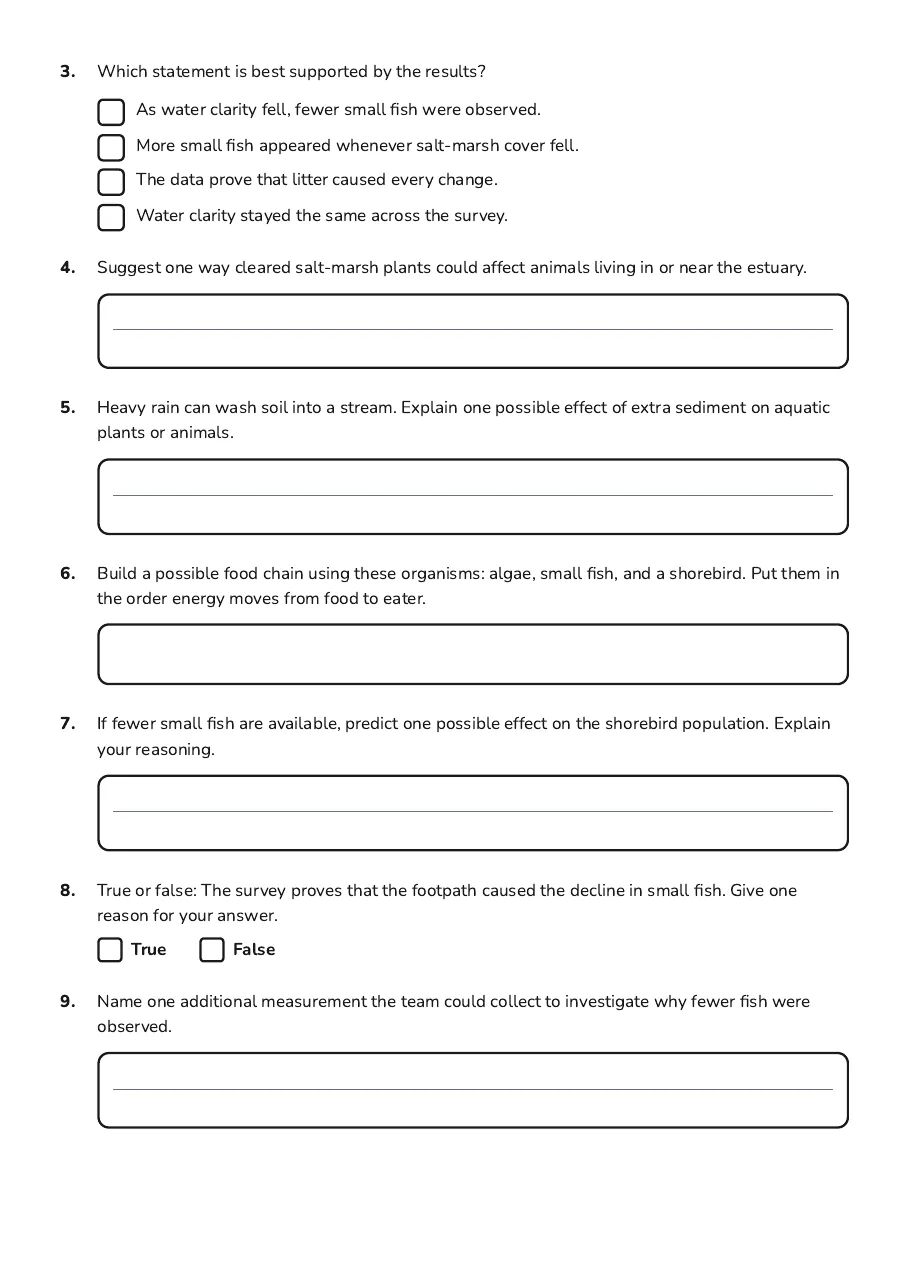
- As water clarity fell, fewer small fish were observed.
- More small fish appeared whenever salt-marsh cover fell.
- The data prove that litter caused every change.
- Water clarity stayed the same across the survey.
3 printable pages
Page 1
Page 2
Page 3
About This Worksheet
Free in Kuraplan
Sign up free, grab the PDF, and customize it for your class.
Print-Ready
Formatted for standard paper. Clean layout, easy to read.
AI-Generated
Created with Kuraplan's AI, designed for real classroom use.
For Teachers & Parents
Use in classrooms, for homework, tutoring, or homeschool.
Need a custom version of this worksheet?
Kuraplan's AI generates custom worksheets in seconds — differentiated for every learner, aligned to your curriculum.
Generate Custom Worksheets — FreeMore Science Worksheets
Kaitiaki Ecosystem Map Worksheet
Free
Climate Shapes Ecosystems
Free
Ecosystem Roles Sorting Activity
Free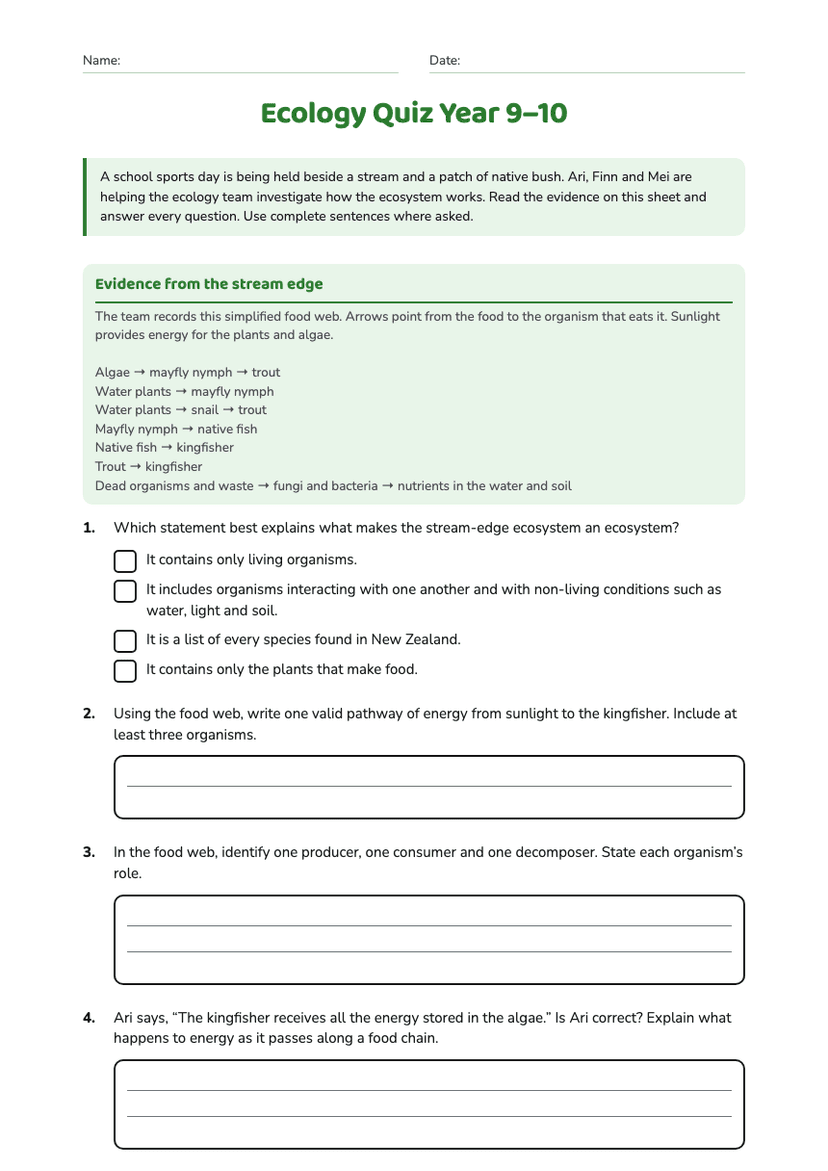
Ecology Quiz Year 9–10
Free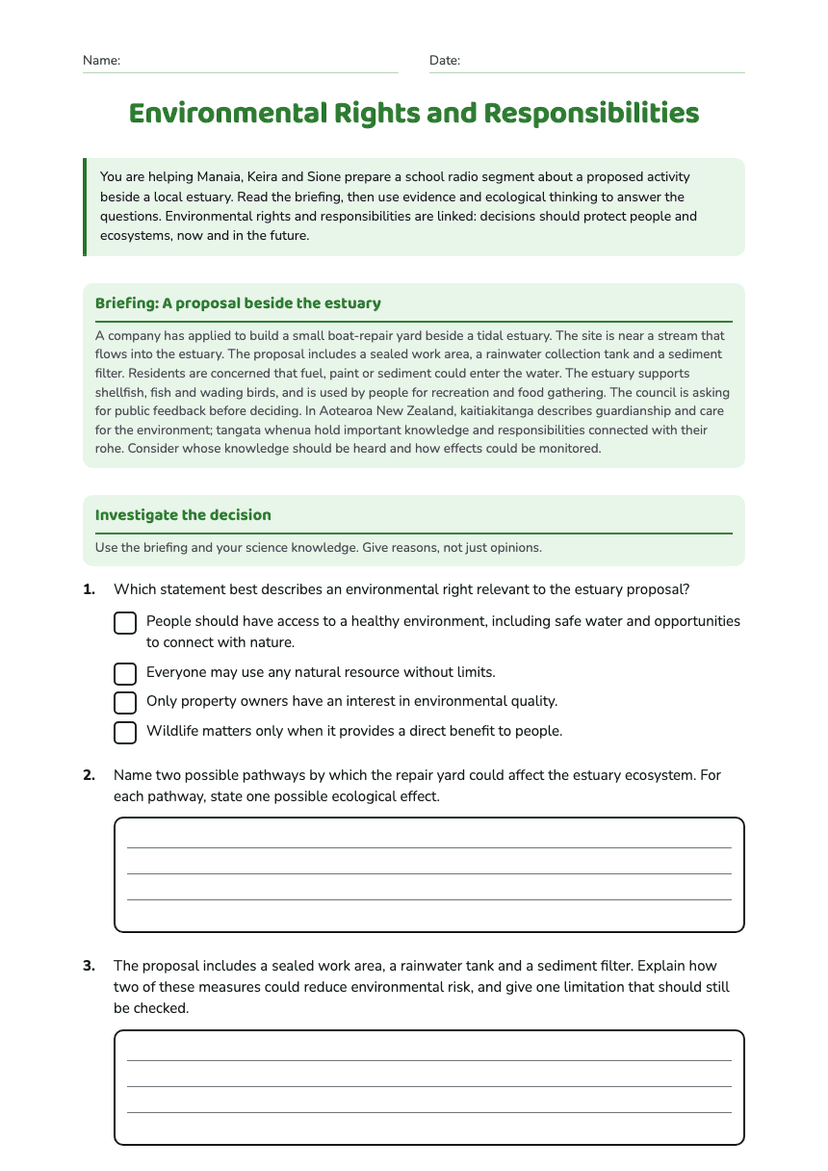
Environmental Rights and Responsibilities
Free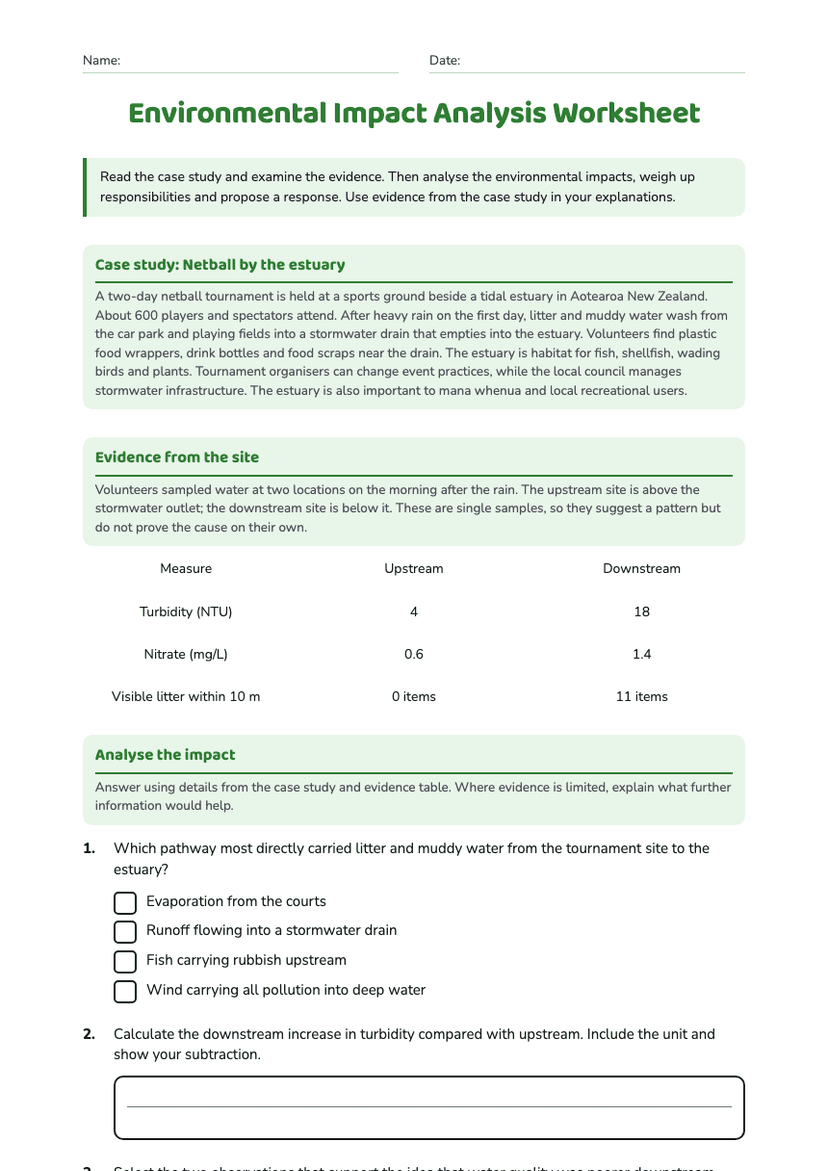
Environmental Impact Analysis Worksheet
Free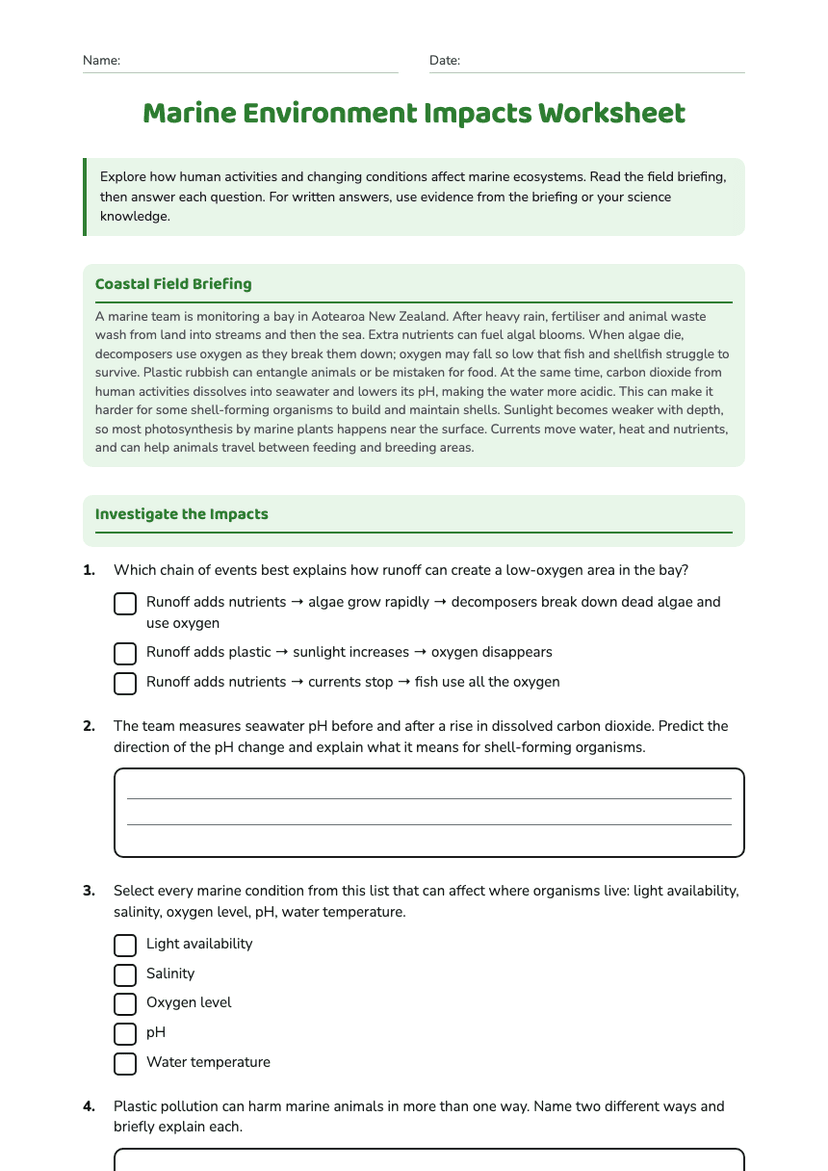
Marine Environment Impacts Worksheet
Free