BusinessFreePrintable

Financial Viability Worksheet

A free business worksheet ready for your classroom. Open in Kuraplan to grab the print-ready PDF, customize it for your students, or generate a fresh version in seconds.
Financial Viability Worksheet worksheet preview
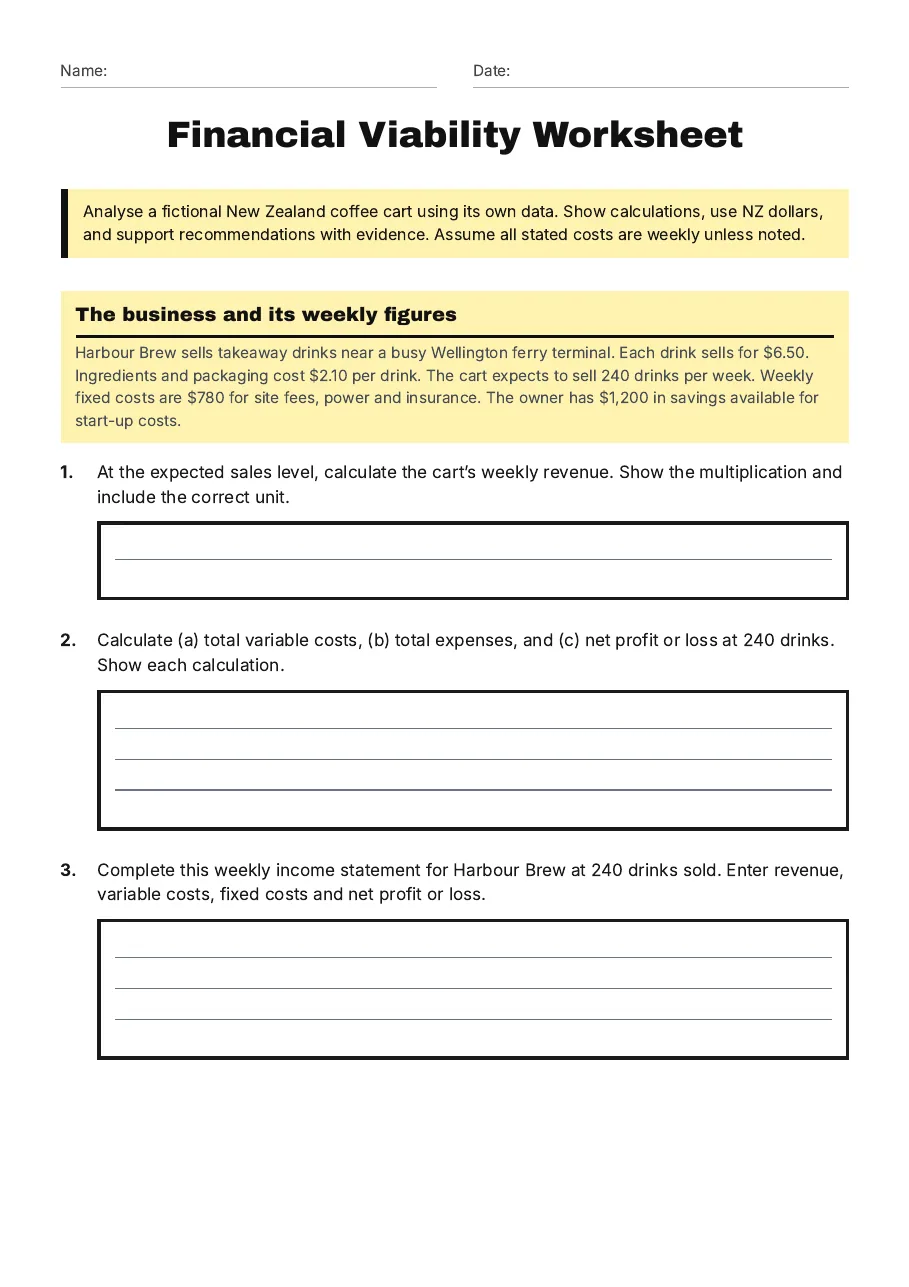
Name:Date:

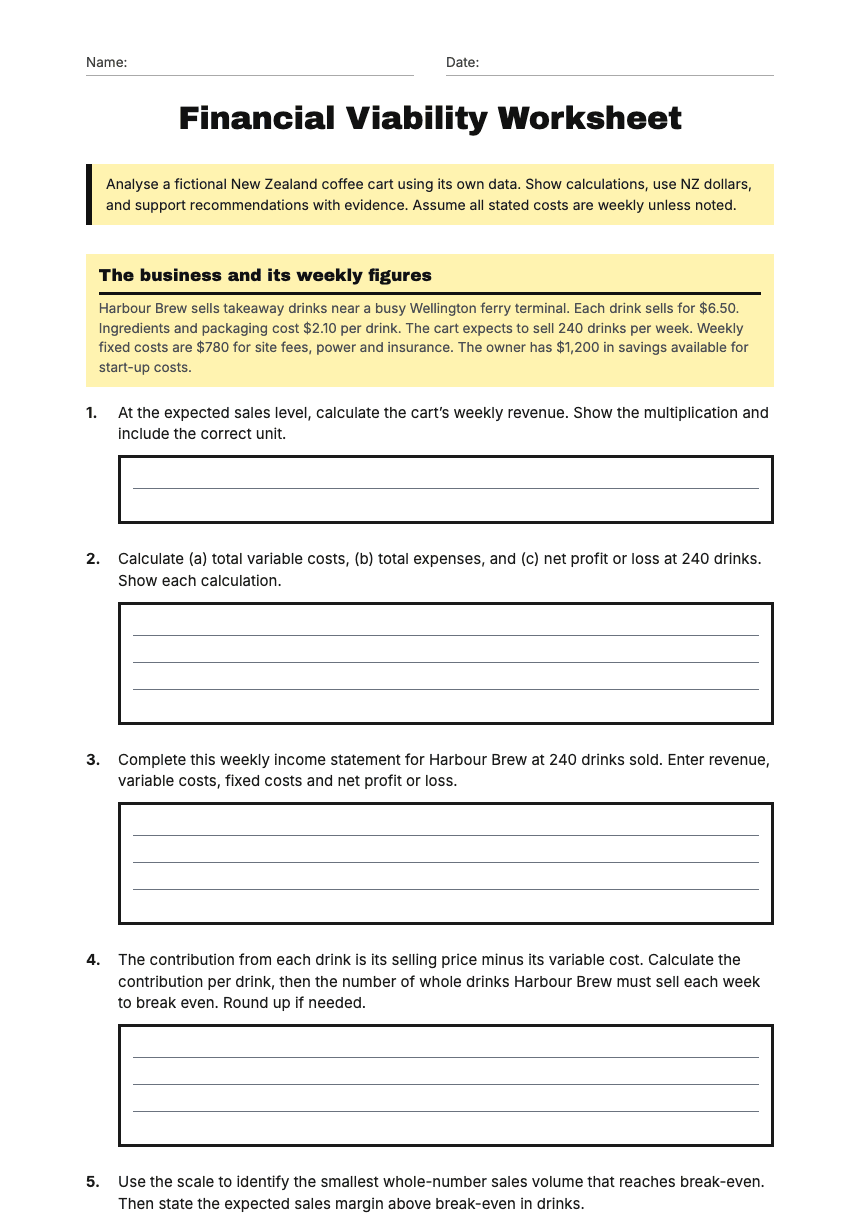
Financial Viability Worksheet

Analyse a fictional New Zealand coffee cart using its own data. Show calculations, use NZ dollars, and support recommendations with evidence. Assume all stated costs are weekly unless noted.

The business and its weekly figures

Harbour Brew sells takeaway drinks near a busy Wellington ferry terminal. Each drink sells for $6.50. Ingredients and packaging cost $2.10 per drink. The cart expects to sell 240 drinks per week. Weekly fixed costs are $780 for site fees, power and insurance. The owner has $1,200 in savings available for start-up costs.

1.At the expected sales level, calculate the cart’s weekly revenue. Show the multiplication and include the correct unit.
2.Calculate (a) total variable costs, (b) total expenses, and (c) net profit or loss at 240 drinks. Show each calculation.
3.Complete this weekly income statement for Harbour Brew at 240 drinks sold. Enter revenue, variable costs, fixed costs and net profit or loss.
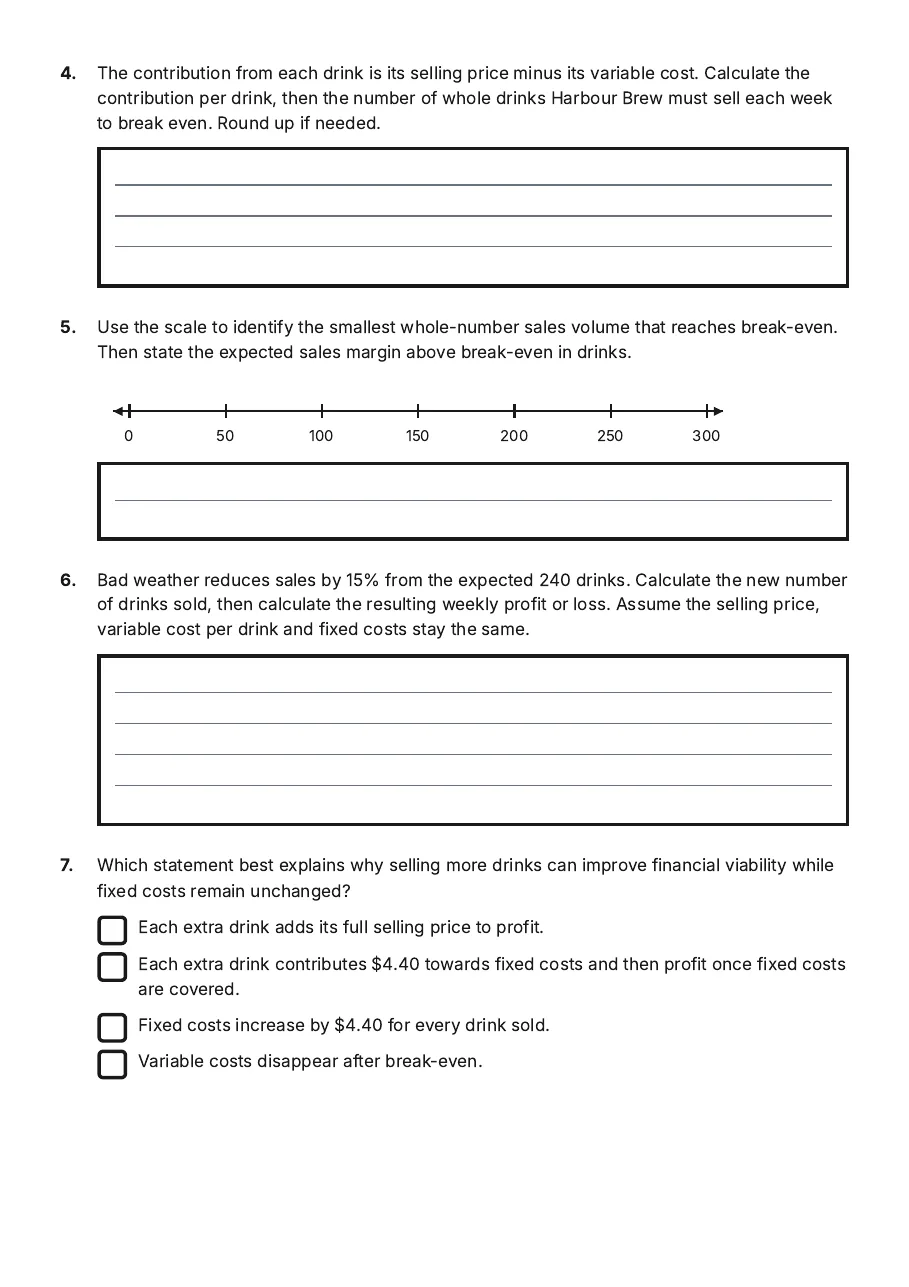
4.The contribution from each drink is its selling price minus its variable cost. Calculate the contribution per drink, then the number of whole drinks Harbour Brew must sell each week to break even. Round up if needed.
5.Use the scale to identify the smallest whole-number sales volume that reaches break-even. Then state the expected sales margin above break-even in drinks.
050100150200250300
6.Bad weather reduces sales by 15% from the expected 240 drinks. Calculate the new number of drinks sold, then calculate the resulting weekly profit or loss. Assume the selling price, variable cost per drink and fixed costs stay the same.
7.Which statement best explains why selling more drinks can improve financial viability while fixed costs remain unchanged?
  • Each extra drink adds its full selling price to profit.
  • Each extra drink contributes $4.40 towards fixed costs and then profit once fixed costs are covered.
  • Fixed costs increase by $4.40 for every drink sold.
  • Variable costs disappear after break-even.
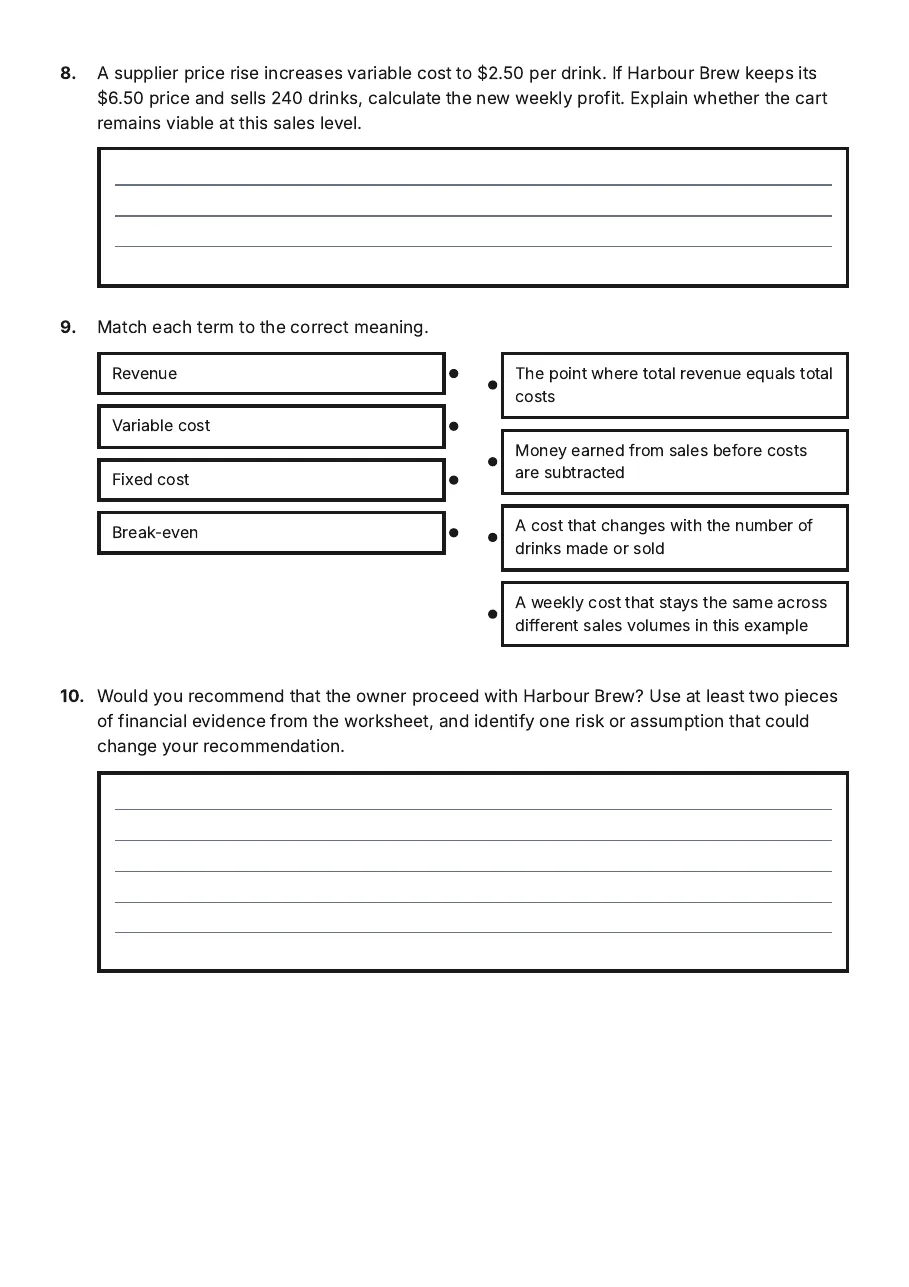
8.A supplier price rise increases variable cost to $2.50 per drink. If Harbour Brew keeps its $6.50 price and sells 240 drinks, calculate the new weekly profit. Explain whether the cart remains viable at this sales level.
9.Match each term to the correct meaning.
  • Revenue
  • Variable cost
  • Fixed cost
  • Break-even
  • The point where total revenue equals total costs
  • Money earned from sales before costs are subtracted
  • A cost that changes with the number of drinks made or sold
  • A weekly cost that stays the same across different sales volumes in this example
10.Would you recommend that the owner proceed with Harbour Brew? Use at least two pieces of financial evidence from the worksheet, and identify one risk or assumption that could change your recommendation.

3 printable pages

  • Financial Viability Worksheet, page 1 of 3: The business and its weekly figures

    Page 1

  • Financial Viability Worksheet, page 2 of 3: 4. The contribution from each drink is its selling price minus its variable cost.…

    Page 2

  • Financial Viability Worksheet, page 3 of 3: 8. A supplier price rise increases variable cost to $2.50 per drink. If Harbour Brew…

    Page 3

About This Worksheet

Free in Kuraplan

Sign up free, grab the PDF, and customize it for your class.

Print-Ready

Formatted for standard paper. Clean layout, easy to read.

AI-Generated

Created with Kuraplan's AI, designed for real classroom use.

For Teachers & Parents

Use in classrooms, for homework, tutoring, or homeschool.

Need a custom version of this worksheet?

Kuraplan's AI generates custom worksheets in seconds — differentiated for every learner, aligned to your curriculum.

Generate Custom Worksheets — Free
No credit card Curriculum-aligned Under 60 seconds

Explore more free resources