Fruit Consumption Picture Graph
A free maths worksheet ready for your classroom. Open in Kuraplan to grab the print-ready PDF, customize it for your students, or generate a fresh version in seconds.
🍎 Fruit Consumption Picture Graph

📊 Our Fruit Picture Graph
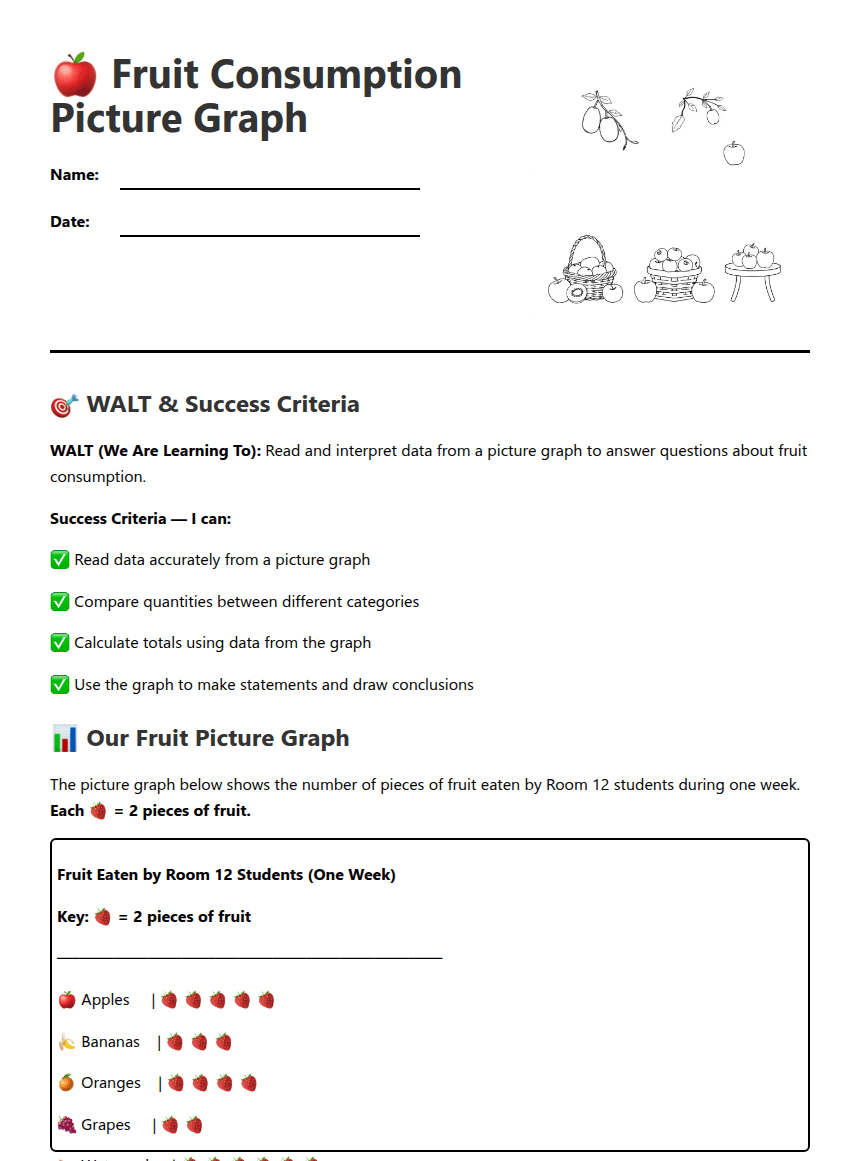
The picture graph below shows the number of pieces of fruit eaten by Room 12 students during one week. Each 🍓 = 2 pieces of fruit.
Fruit Eaten by Room 12 Students (One Week)
Key: 🍓 = 2 pieces of fruit
──────────────────────────────────
🍎 Apples | 🍓 🍓 🍓 🍓 🍓
🍌 Bananas | 🍓 🍓 🍓
🍊 Oranges | 🍓 🍓 🍓 🍓
🍇 Grapes | 🍓 🍓
🍉 Watermelon | 🍓 🍓 🍓 🍓 🍓 🍓
──────────────────────────────────
(Each symbol represents 2 pieces of fruit)
✏️ Part 1: Reading the Graph
Fruit | Number of Symbols | Total Pieces of Fruit
──────────────────────────────────────────
🍎 Apples | _____________________ | _____________________
🍌 Bananas | _____________________ | _____________________
🍊 Oranges | _____________________ | _____________________
🍇 Grapes | _____________________ | _____________________
🍉 Watermelon | _____________________ | _____________________
Most popular fruit: _______________________
Least popular fruit: _______________________
Answer: _______________________ more pieces of watermelon were eaten.
Total: _______________________ pieces of fruit.
💬 Part 2: Interpret & Reflect
✅ Answers
1. Fill in the table:
🍎 Apples | 5 | 10 pieces
🍌 Bananas | 3 | 6 pieces
🍊 Oranges | 4 | 8 pieces
🍇 Grapes | 2 | 4 pieces
🍉 Watermelon | 6 | 12 pieces
2. Most popular fruit: Watermelon; Least popular fruit: Grapes.
3. Answer: 6 more pieces of watermelon were eaten.
4. Total: 40 pieces of fruit.
5. Example statements: "Room 12 students ate more watermelon than any other fruit." "Grapes were the least consumed fruit."
6. If 4 more students each ate 1 orange, there would be 12 oranges in total.
About This Worksheet
Free in Kuraplan
Sign up free, grab the PDF, and customize it for your class.
Print-Ready
Formatted for standard paper. Clean layout, easy to read.
AI-Generated
Created with Kuraplan's AI, designed for real classroom use.
For Teachers & Parents
Use in classrooms, for homework, tutoring, or homeschool.
Need a custom version of this worksheet?
Kuraplan's AI generates custom worksheets in seconds — differentiated for every learner, aligned to your curriculum.
Generate Custom Worksheets — Free