MathsFreePrintable
Data Collection and Graphing
A free maths worksheet ready for your classroom. Open in Kuraplan to grab the print-ready PDF, customize it for your students, or generate a fresh version in seconds.
Data Collection and Graphing

📚 Part 1: Read the Tally Chart
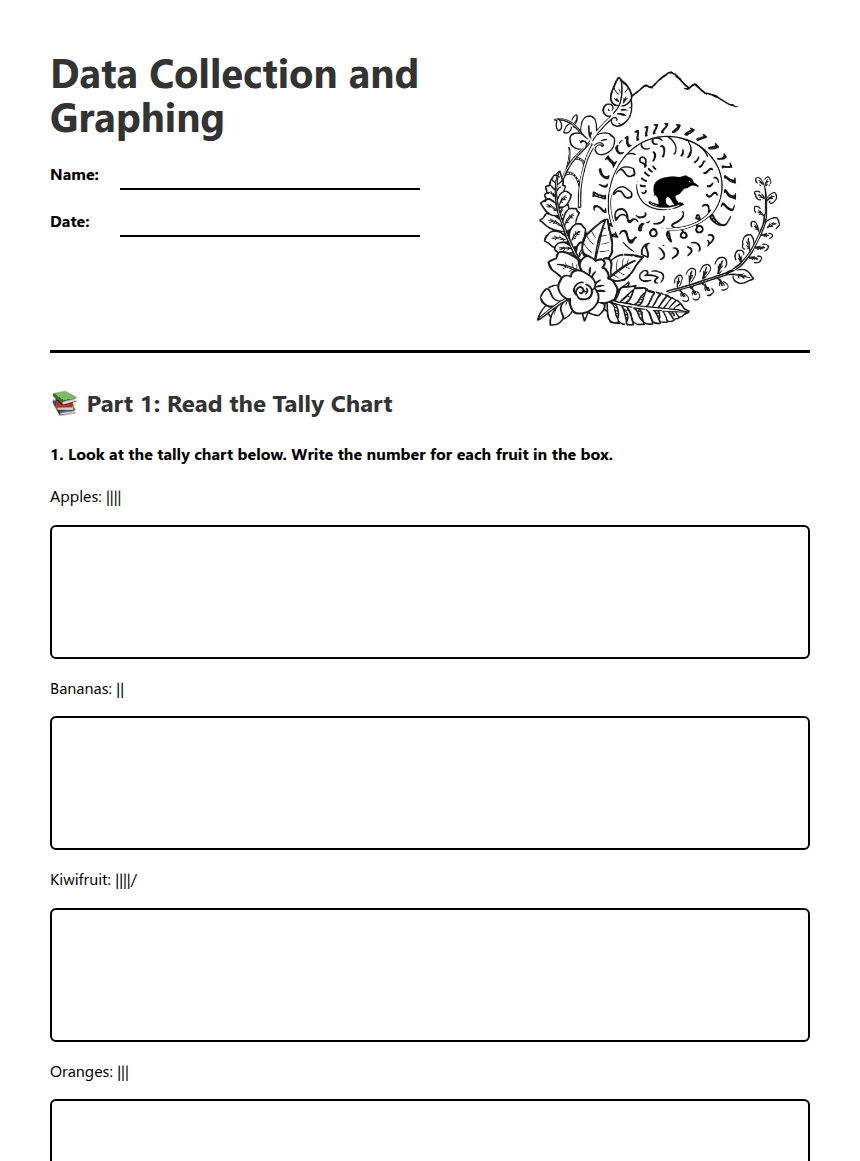
1. Look at the tally chart below. Write the number for each fruit in the box.
Apples: ||||
Bananas: ||
Kiwifruit: ||||/
Oranges: |||
2. Which fruit is the most popular?
Apples
Bananas
Kiwifruit
Oranges
3. Are any two fruits the same number?
Yes
No
If yes, which ones? (If no, write "No")
4. Write one sentence that starts "I notice..." about the chart above.
✏️ Part 2: Collect and Show Your Own Data
5. Ask 5 classmates: "Which pet do you like best?" Tally their answers below (one tally mark = one person).
Dog: _____
Cat: _____
Fish: _____
Bird: _____
6. Now use your tallies to draw a picture graph. Use one picture or sticker for each person.
7. How many people did you ask?
8. Write one thing you notice about your picture graph. Start with "I notice..."
About This Worksheet
Free in Kuraplan
Sign up free, grab the PDF, and customize it for your class.
Print-Ready
Formatted for standard paper. Clean layout, easy to read.
AI-Generated
Created with Kuraplan's AI, designed for real classroom use.
For Teachers & Parents
Use in classrooms, for homework, tutoring, or homeschool.
Need a custom version of this worksheet?
Kuraplan's AI generates custom worksheets in seconds — differentiated for every learner, aligned to your curriculum.
Generate Custom Worksheets — Free No credit card Curriculum-aligned Under 60 seconds







