Linear Equations Graphing
A free maths worksheet ready for your classroom. Open in Kuraplan to grab the print-ready PDF, customize it for your students, or generate a fresh version in seconds.
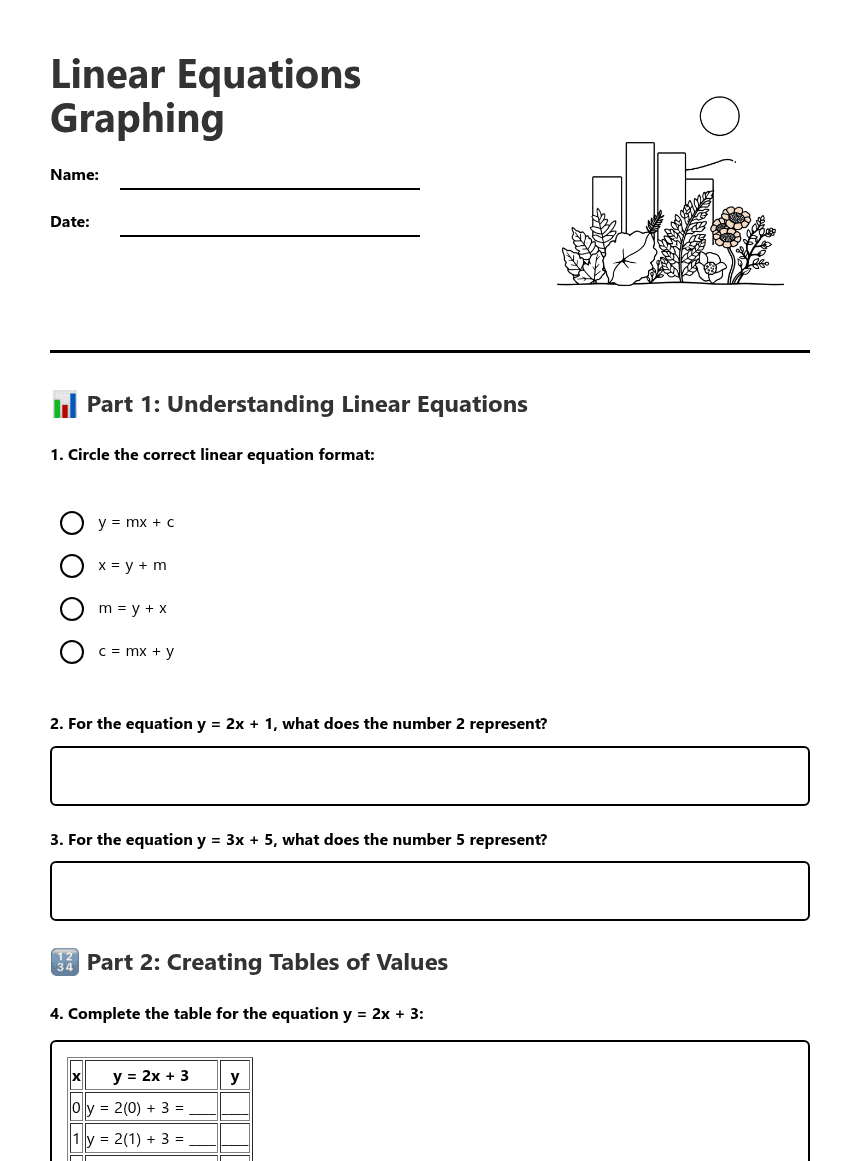
Linear Equations Graphing

📊 Part 1: Understanding Linear Equations
🔢 Part 2: Creating Tables of Values
| x | y = 2x + 3 | y |
|---|---|---|
| 0 | y = 2(0) + 3 = ____ | ____ |
| 1 | y = 2(1) + 3 = ____ | ____ |
| 2 | y = 2(2) + 3 = ____ | ____ |
| 3 | y = 2(3) + 3 = ____ | ____ |
| 4 | y = 2(4) + 3 = ____ | ____ |
| x | Calculation | y |
|---|---|---|
| 0 | ________________ | ____ |
| 1 | ________________ | ____ |
| 2 | ________________ | ____ |
| 3 | ________________ | ____ |
| 5 | ________________ | ____ |
📍 Part 3: Coordinate Pairs and Plotting
When x = 0, y = ____, so the coordinate pair is ( ____, ____ )
When x = 1, y = ____, so the coordinate pair is ( ____, ____ )
When x = 2, y = ____, so the coordinate pair is ( ____, ____ )
When x = 3, y = ____, so the coordinate pair is ( ____, ____ )
When x = 4, y = ____, so the coordinate pair is ( ____, ____ )
Use this space to draw your coordinate grid and plot the points
🧮 Part 4: Problem Solving
🔗 Part 5: Making Connections
About This Worksheet
Free in Kuraplan
Sign up free, grab the PDF, and customize it for your class.
Print-Ready
Formatted for standard paper. Clean layout, easy to read.
AI-Generated
Created with Kuraplan's AI, designed for real classroom use.
For Teachers & Parents
Use in classrooms, for homework, tutoring, or homeschool.
Need a custom version of this worksheet?
Kuraplan's AI generates custom worksheets in seconds — differentiated for every learner, aligned to your curriculum.
Generate Custom Worksheets — FreeMore Maths Worksheets
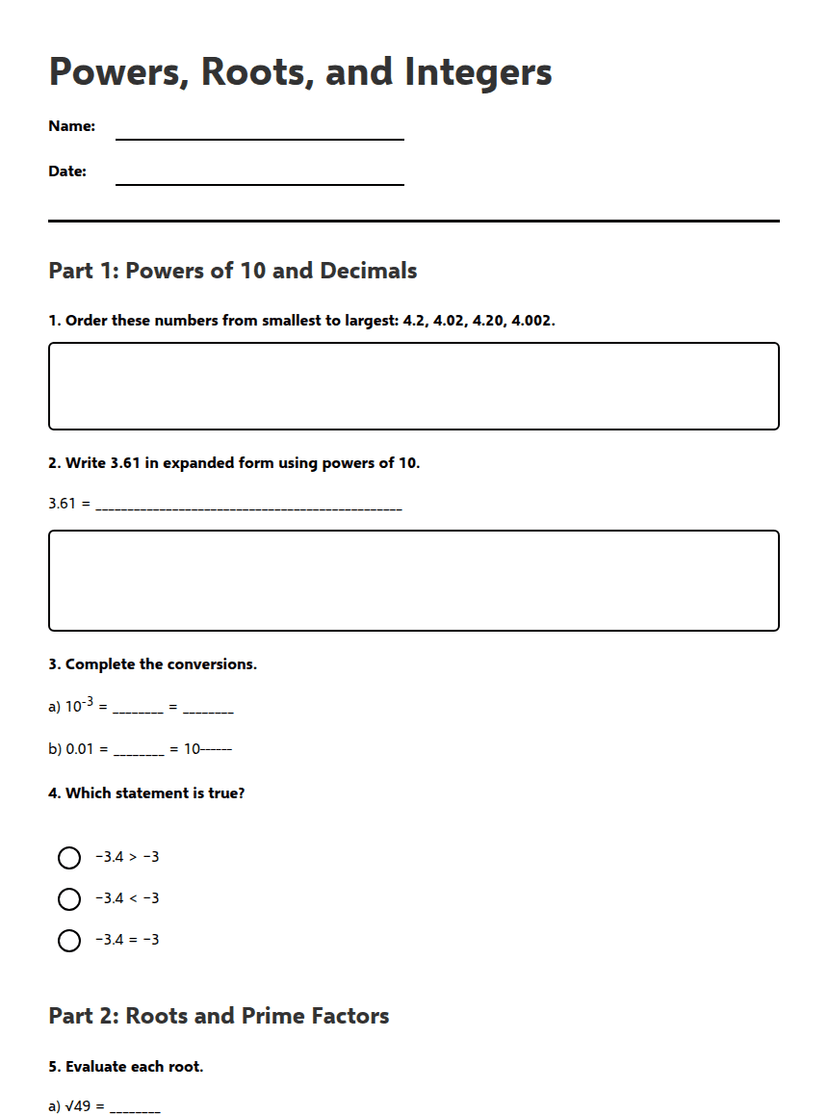
Powers, Roots, and Integers
Free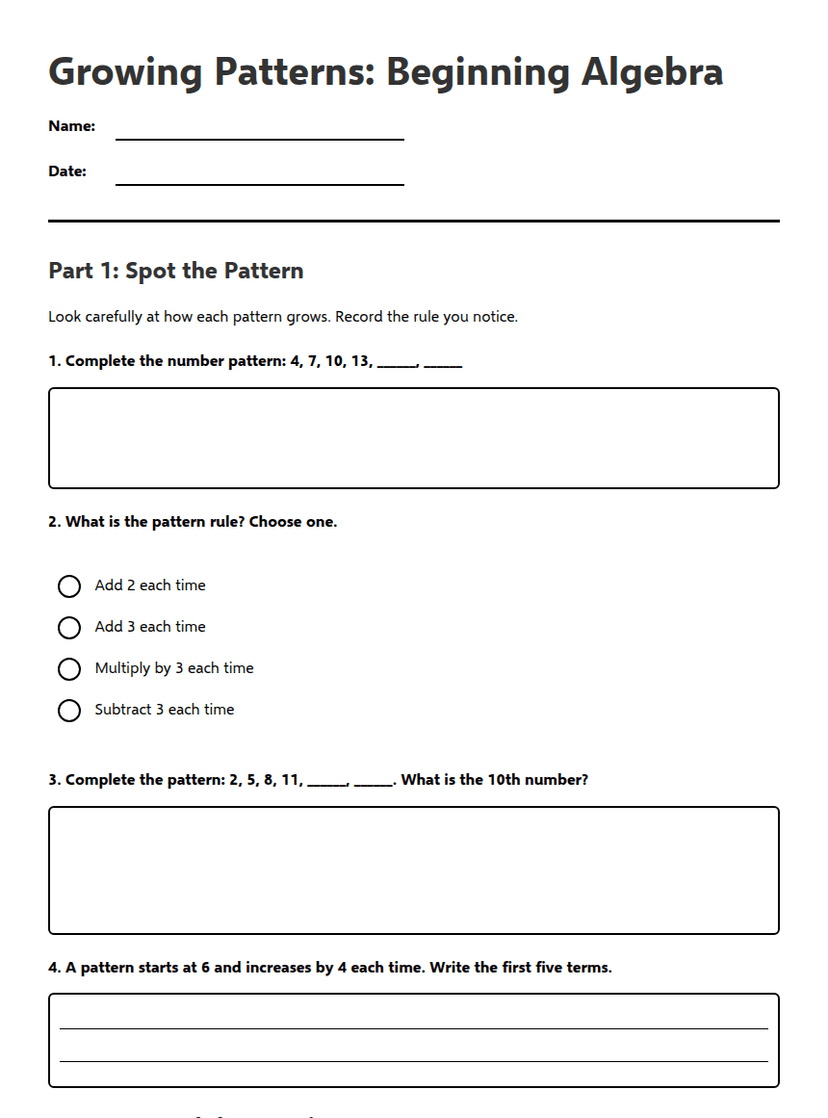
Growing Patterns: Beginning Algebra
Free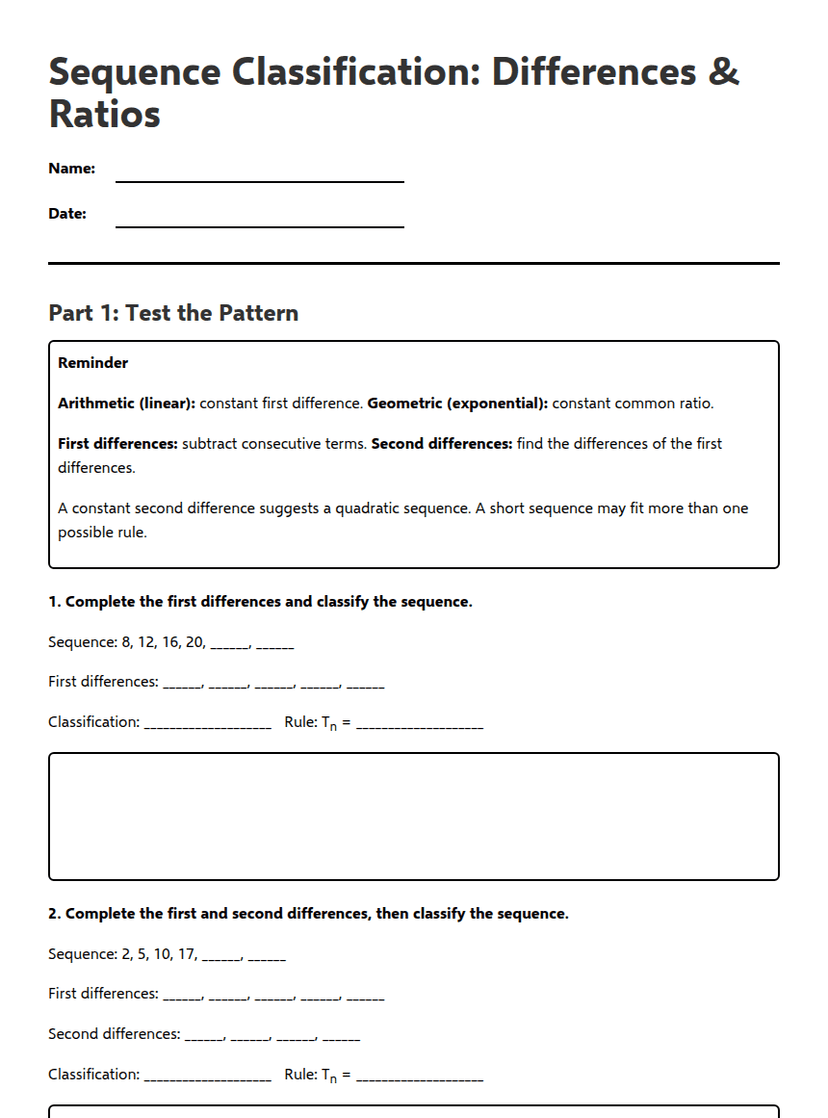
Sequence Classification: Differences & Ratios
Free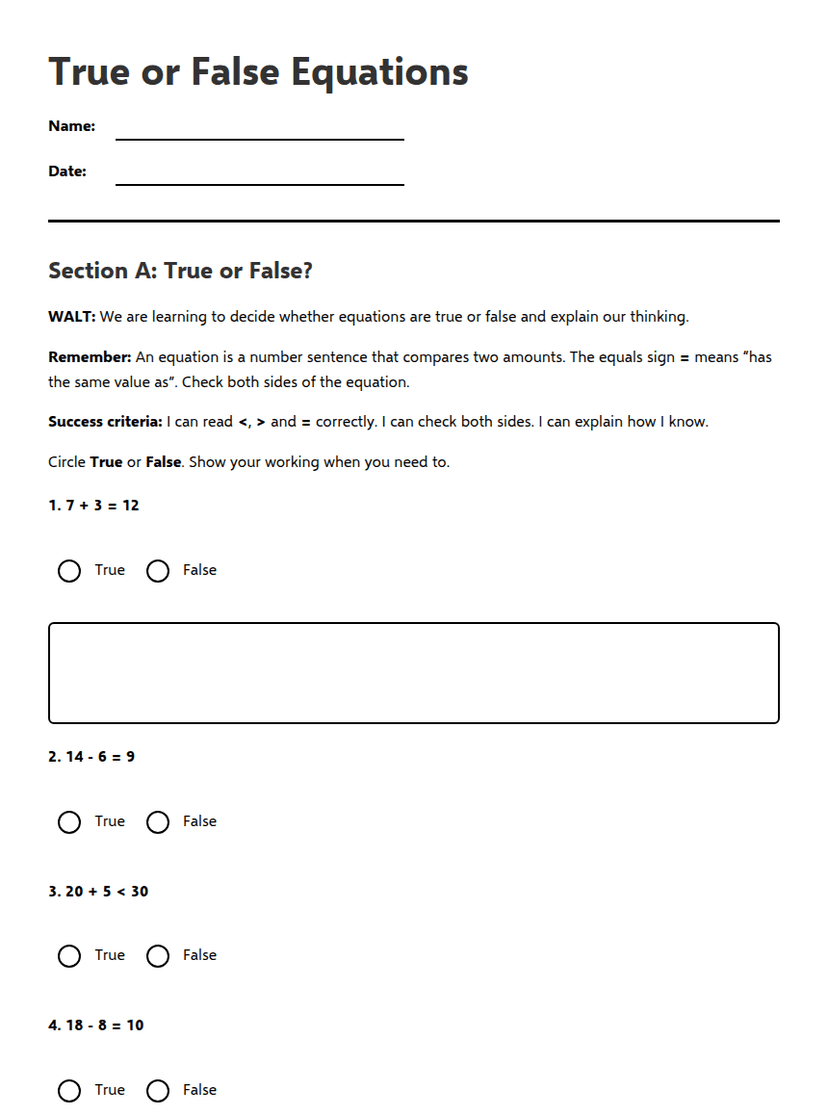
True or False Equations
Free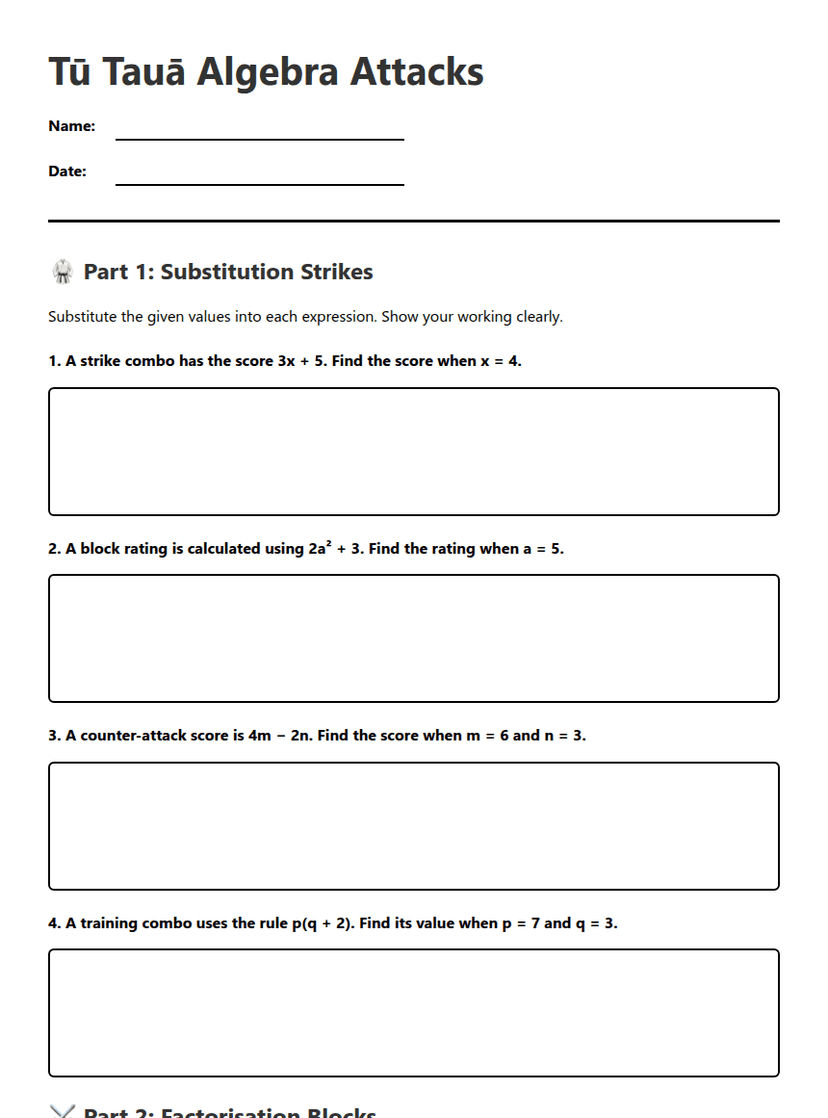
Tū Tauā Algebra Attacks
Free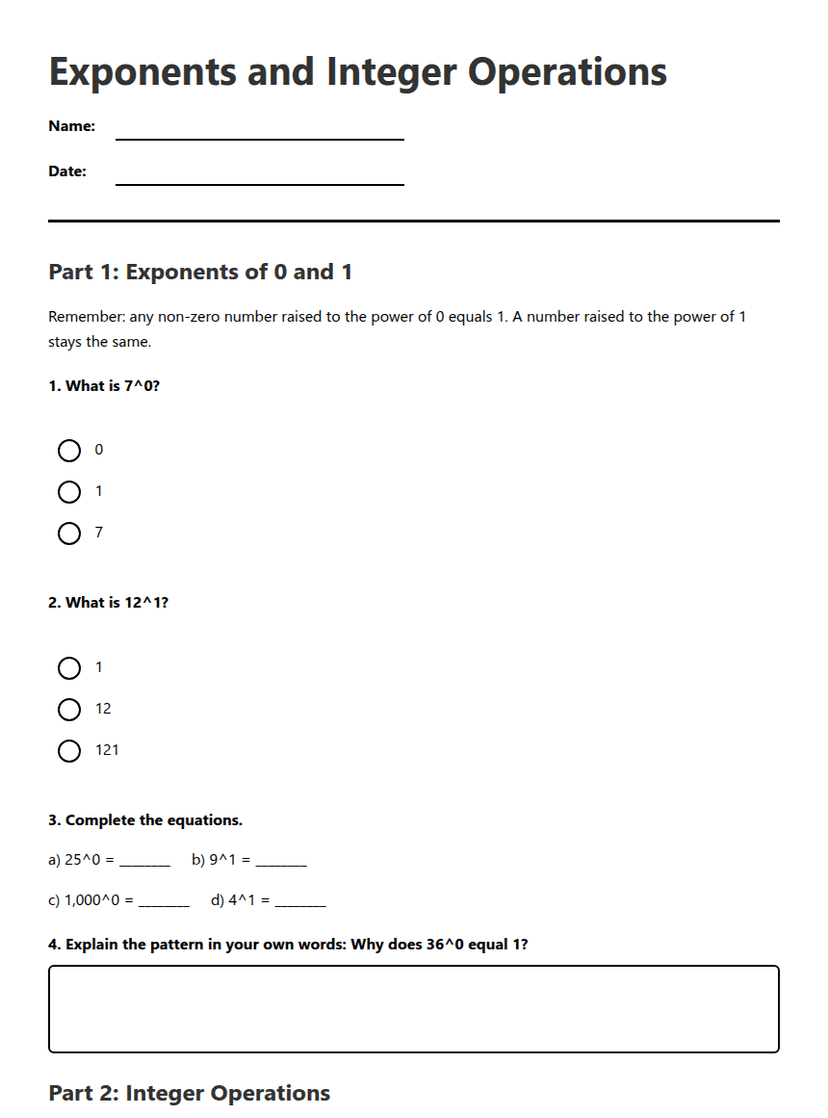
Exponents and Integer Operations
Free
Two-Step Addition Division Equations
Free