NZ Ecosystems Climate Impact
A free science worksheet ready for your classroom. Open in Kuraplan to grab the print-ready PDF, customize it for your students, or generate a fresh version in seconds.
NZ Ecosystems Climate Impact
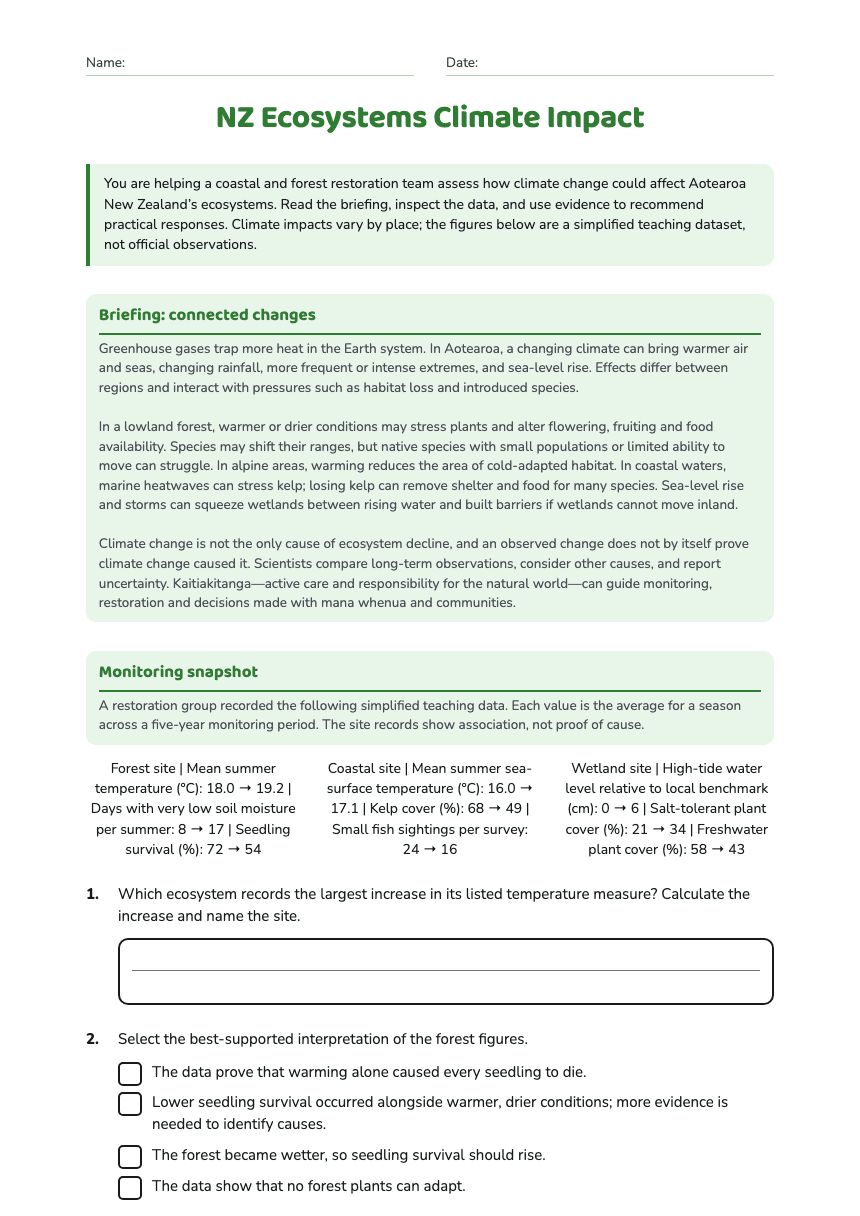
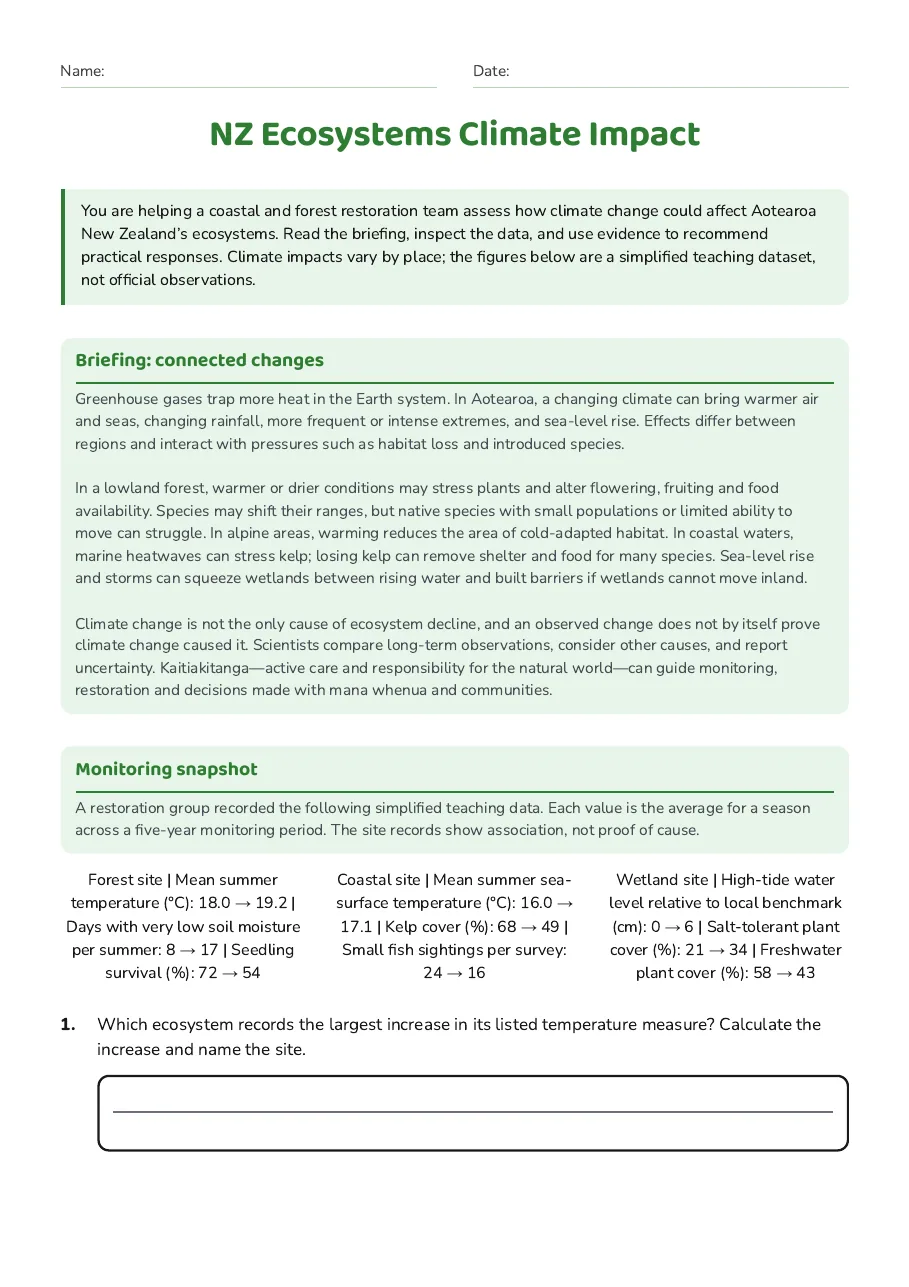
Briefing: connected changes
Greenhouse gases trap more heat in the Earth system. In Aotearoa, a changing climate can bring warmer air and seas, changing rainfall, more frequent or intense extremes, and sea-level rise. Effects differ between regions and interact with pressures such as habitat loss and introduced species. In a lowland forest, warmer or drier conditions may stress plants and alter flowering, fruiting and food availability. Species may shift their ranges, but native species with small populations or limited ability to move can struggle. In alpine areas, warming reduces the area of cold-adapted habitat. In coastal waters, marine heatwaves can stress kelp; losing kelp can remove shelter and food for many species. Sea-level rise and storms can squeeze wetlands between rising water and built barriers if wetlands cannot move inland. Climate change is not the only cause of ecosystem decline, and an observed change does not by itself prove climate change caused it. Scientists compare long-term observations, consider other causes, and report uncertainty. Kaitiakitanga—active care and responsibility for the natural world—can guide monitoring, restoration and decisions made with mana whenua and communities.
Monitoring snapshot
A restoration group recorded the following simplified teaching data. Each value is the average for a season across a five-year monitoring period. The site records show association, not proof of cause.
Forest site | Mean summer temperature (°C): 18.0 → 19.2 | Days with very low soil moisture per summer: 8 → 17 | Seedling survival (%): 72 → 54
Coastal site | Mean summer sea-surface temperature (°C): 16.0 → 17.1 | Kelp cover (%): 68 → 49 | Small fish sightings per survey: 24 → 16
Wetland site | High-tide water level relative to local benchmark (cm): 0 → 6 | Salt-tolerant plant cover (%): 21 → 34 | Freshwater plant cover (%): 58 → 43
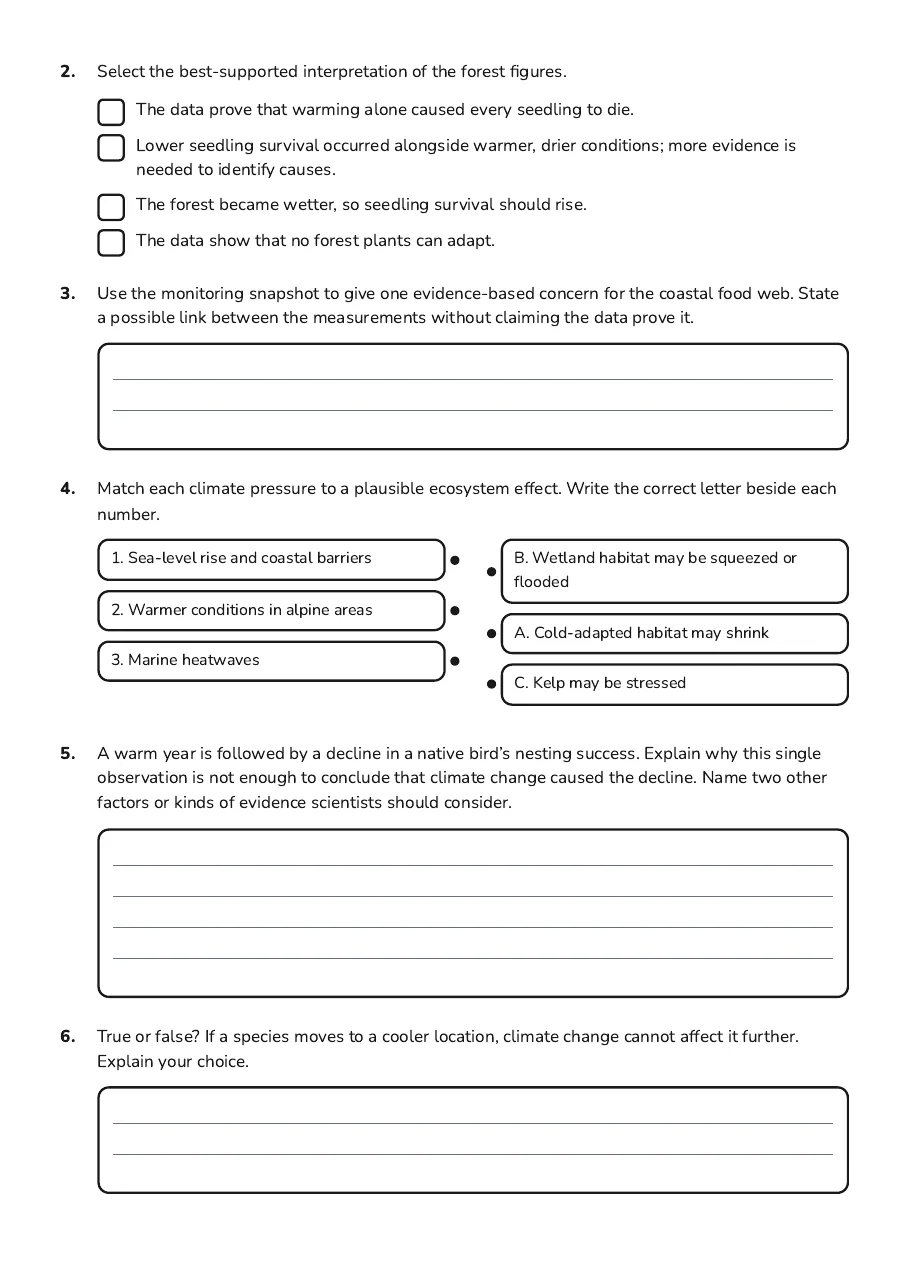
- The data prove that warming alone caused every seedling to die.
- Lower seedling survival occurred alongside warmer, drier conditions; more evidence is needed to identify causes.
- The forest became wetter, so seedling survival should rise.
- The data show that no forest plants can adapt.
- 1. Sea-level rise and coastal barriers
- 2. Warmer conditions in alpine areas
- 3. Marine heatwaves
- B. Wetland habitat may be squeezed or flooded
- A. Cold-adapted habitat may shrink
- C. Kelp may be stressed
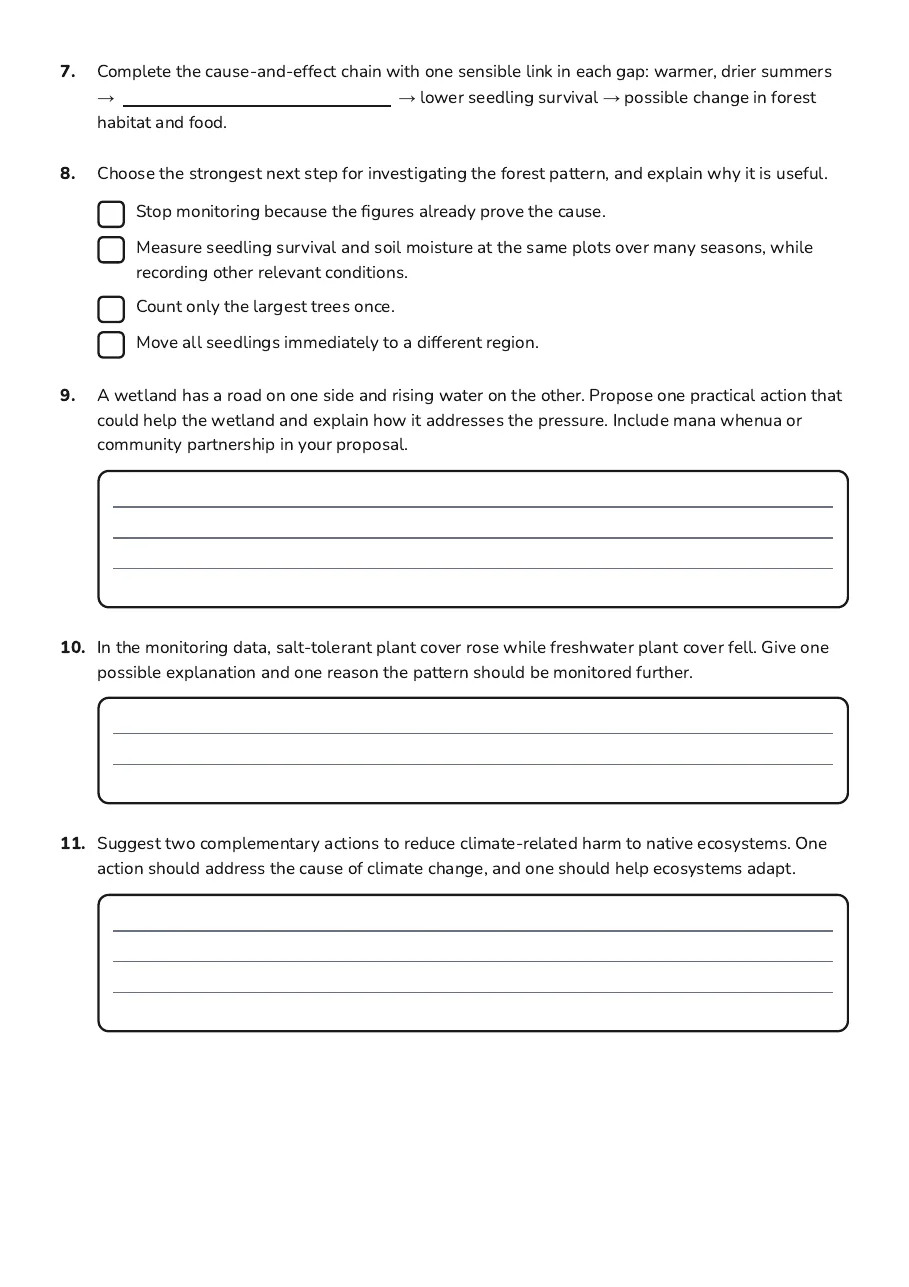
- Stop monitoring because the figures already prove the cause.
- Measure seedling survival and soil moisture at the same plots over many seasons, while recording other relevant conditions.
- Count only the largest trees once.
- Move all seedlings immediately to a different region.
3 printable pages
Page 1
Page 2
Page 3
About This Worksheet
Free in Kuraplan
Sign up free, grab the PDF, and customize it for your class.
Print-Ready
Formatted for standard paper. Clean layout, easy to read.
AI-Generated
Created with Kuraplan's AI, designed for real classroom use.
For Teachers & Parents
Use in classrooms, for homework, tutoring, or homeschool.
Need a custom version of this worksheet?
Kuraplan's AI generates custom worksheets in seconds — differentiated for every learner, aligned to your curriculum.
Generate Custom Worksheets — FreeMore Science Worksheets
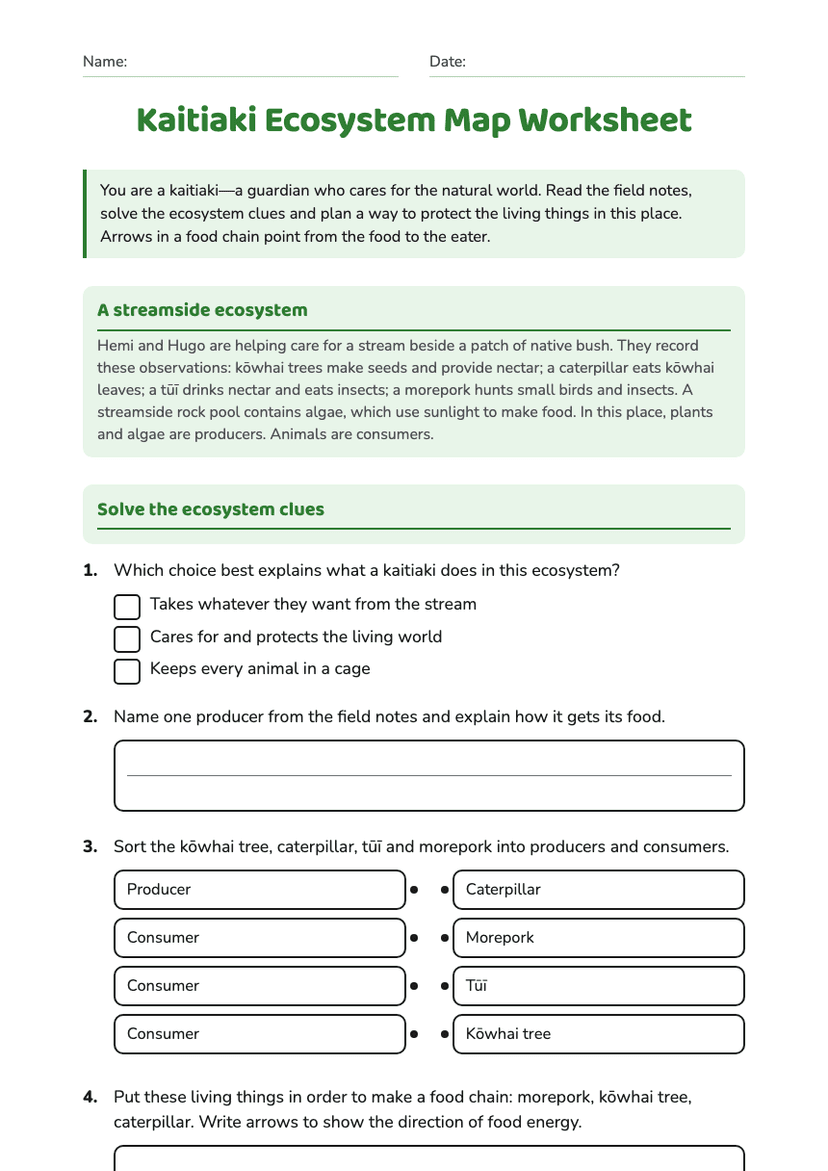
Kaitiaki Ecosystem Map Worksheet
Free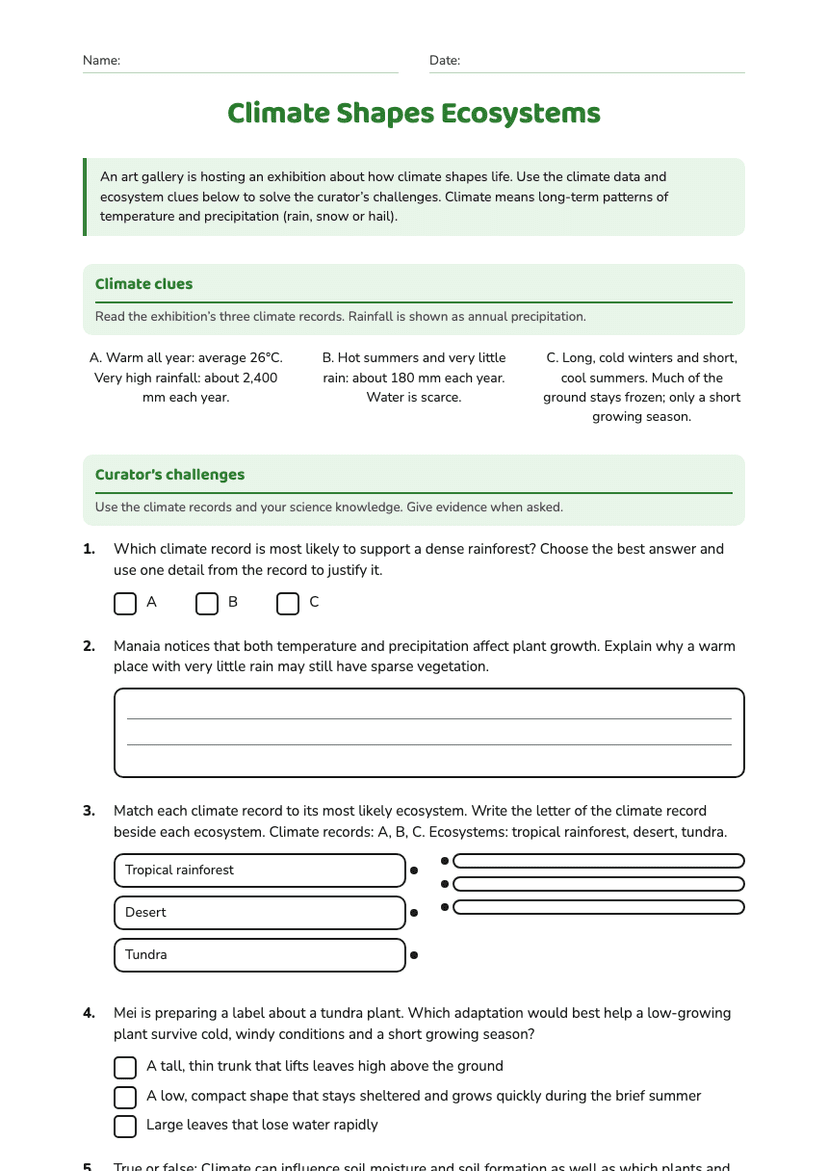
Climate Shapes Ecosystems
Free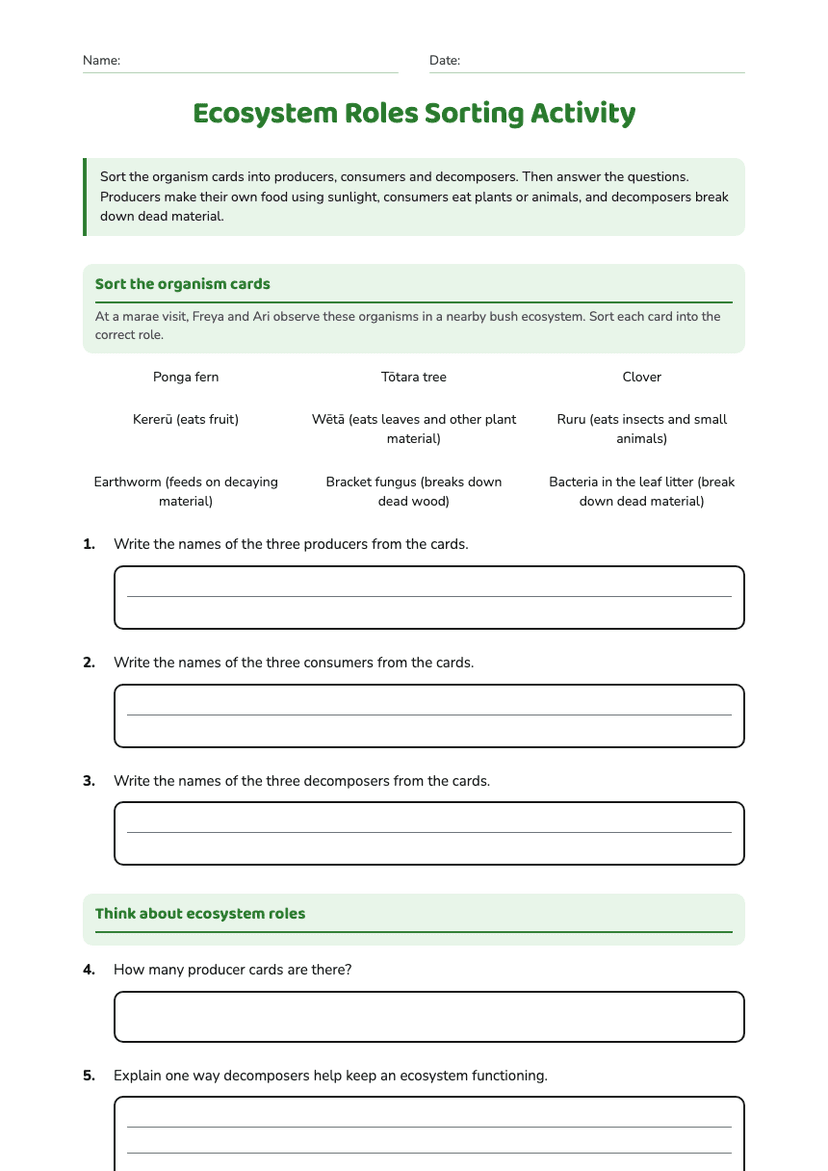
Ecosystem Roles Sorting Activity
Free
Ecology Quiz Year 9–10
Free
Environmental Rights and Responsibilities
Free
Environmental Impact Analysis Worksheet
Free
Marine Environment Impacts Worksheet
Free