NZ Weather Research Report
A free science worksheet ready for your classroom. Open in Kuraplan to grab the print-ready PDF, customize it for your students, or generate a fresh version in seconds.
NZ Weather Research Report
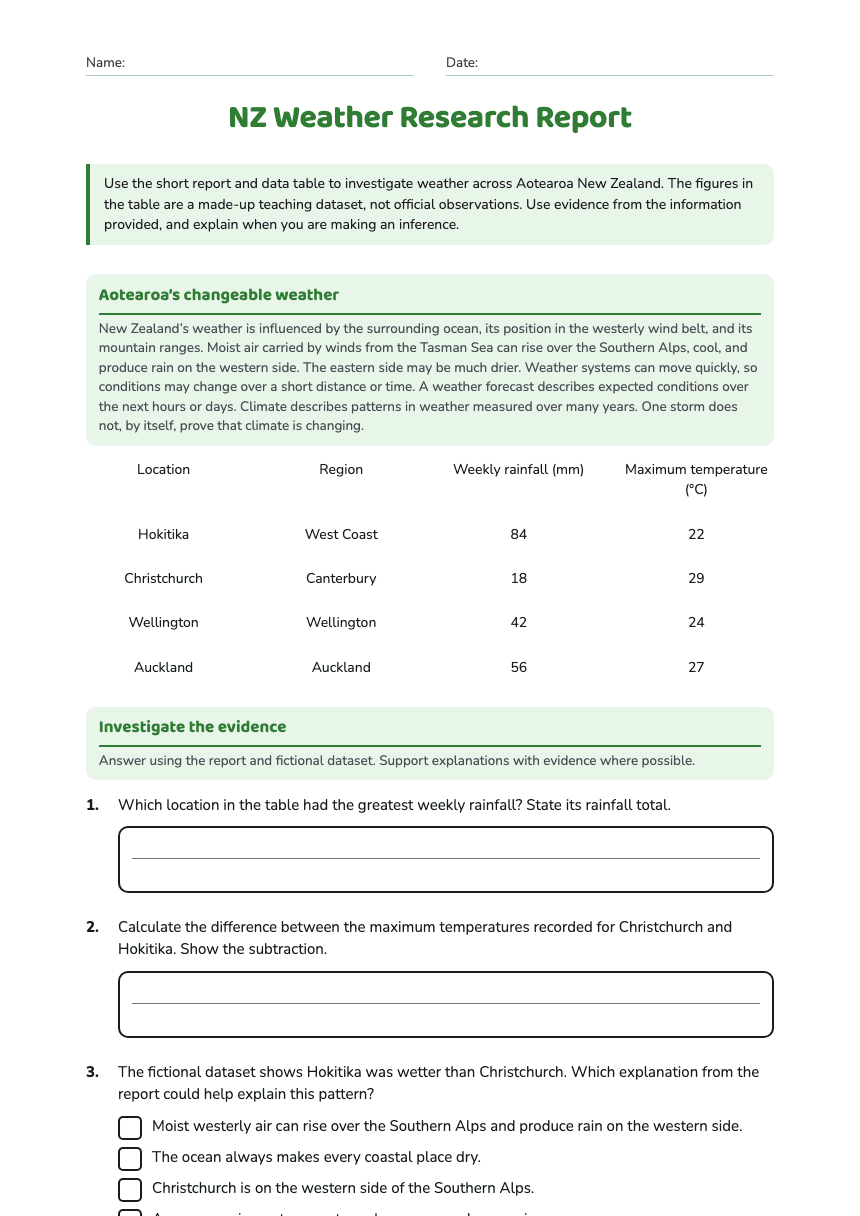
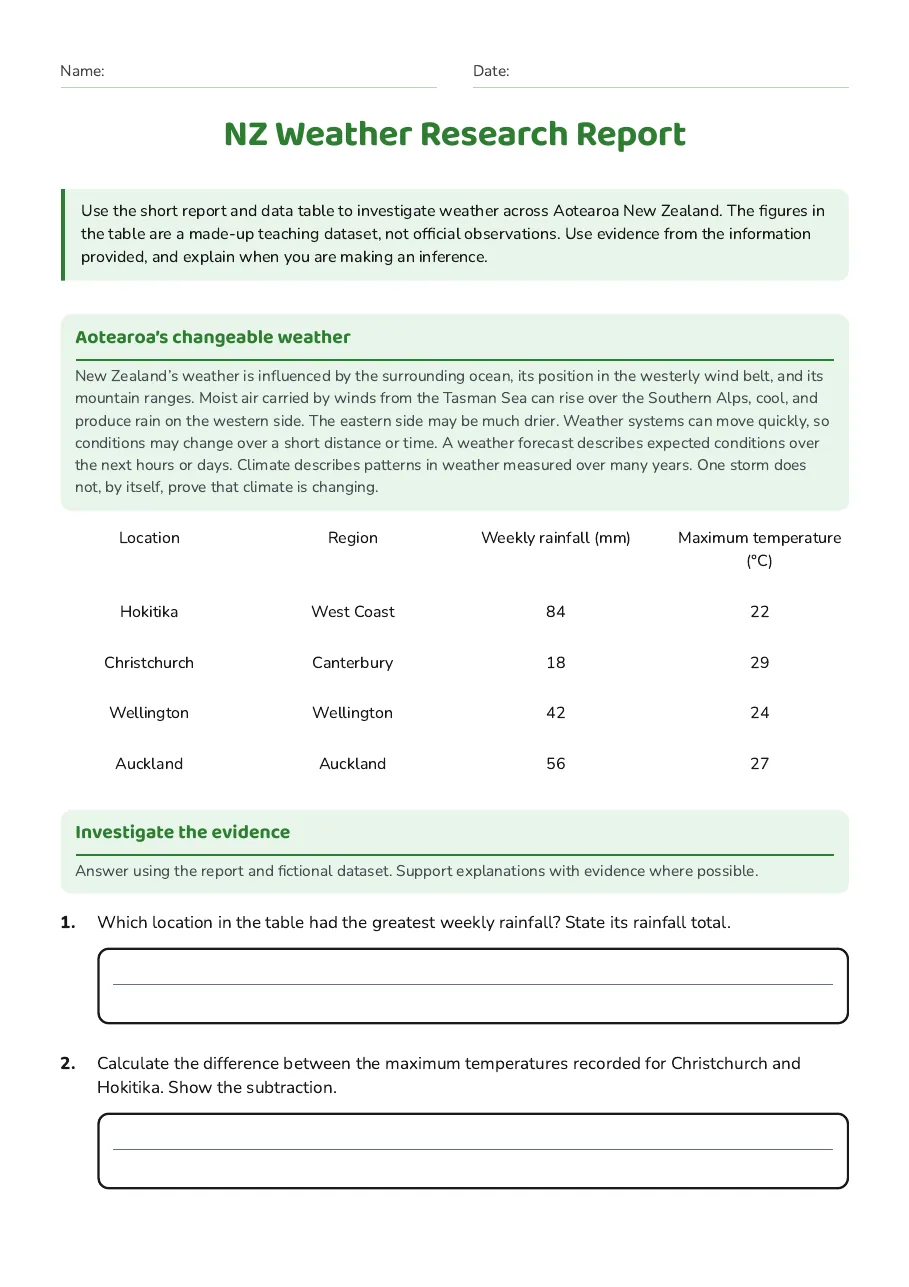
Aotearoa’s changeable weather
New Zealand’s weather is influenced by the surrounding ocean, its position in the westerly wind belt, and its mountain ranges. Moist air carried by winds from the Tasman Sea can rise over the Southern Alps, cool, and produce rain on the western side. The eastern side may be much drier. Weather systems can move quickly, so conditions may change over a short distance or time. A weather forecast describes expected conditions over the next hours or days. Climate describes patterns in weather measured over many years. One storm does not, by itself, prove that climate is changing.
Location
Region
Weekly rainfall (mm)
Maximum temperature (°C)
Hokitika
West Coast
84
22
Christchurch
Canterbury
18
29
Wellington
Wellington
42
24
Auckland
Auckland
56
27
Investigate the evidence
Answer using the report and fictional dataset. Support explanations with evidence where possible.
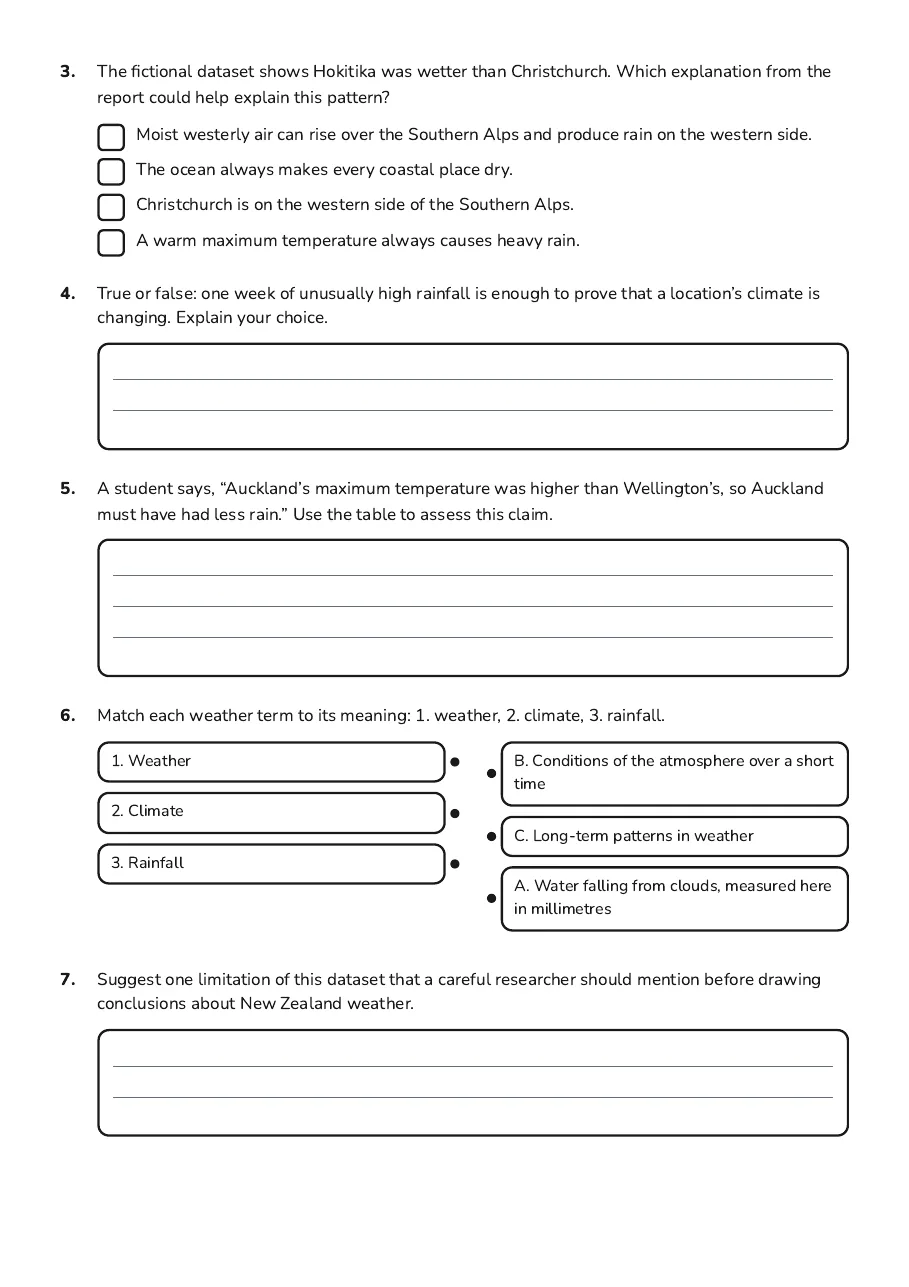
- Moist westerly air can rise over the Southern Alps and produce rain on the western side.
- The ocean always makes every coastal place dry.
- Christchurch is on the western side of the Southern Alps.
- A warm maximum temperature always causes heavy rain.
- 1. Weather
- 2. Climate
- 3. Rainfall
- B. Conditions of the atmosphere over a short time
- C. Long-term patterns in weather
- A. Water falling from clouds, measured here in millimetres
3 printable pages
Page 1
Page 2

Page 3
About This Worksheet
Free in Kuraplan
Sign up free, grab the PDF, and customize it for your class.
Print-Ready
Formatted for standard paper. Clean layout, easy to read.
AI-Generated
Created with Kuraplan's AI, designed for real classroom use.
For Teachers & Parents
Use in classrooms, for homework, tutoring, or homeschool.
Need a custom version of this worksheet?
Kuraplan's AI generates custom worksheets in seconds — differentiated for every learner, aligned to your curriculum.
Generate Custom Worksheets — Free