ScienceFreePrintable

Pine Forestry Ecology Statistics

A free science worksheet ready for your classroom. Open in Kuraplan to grab the print-ready PDF, customize it for your students, or generate a fresh version in seconds.
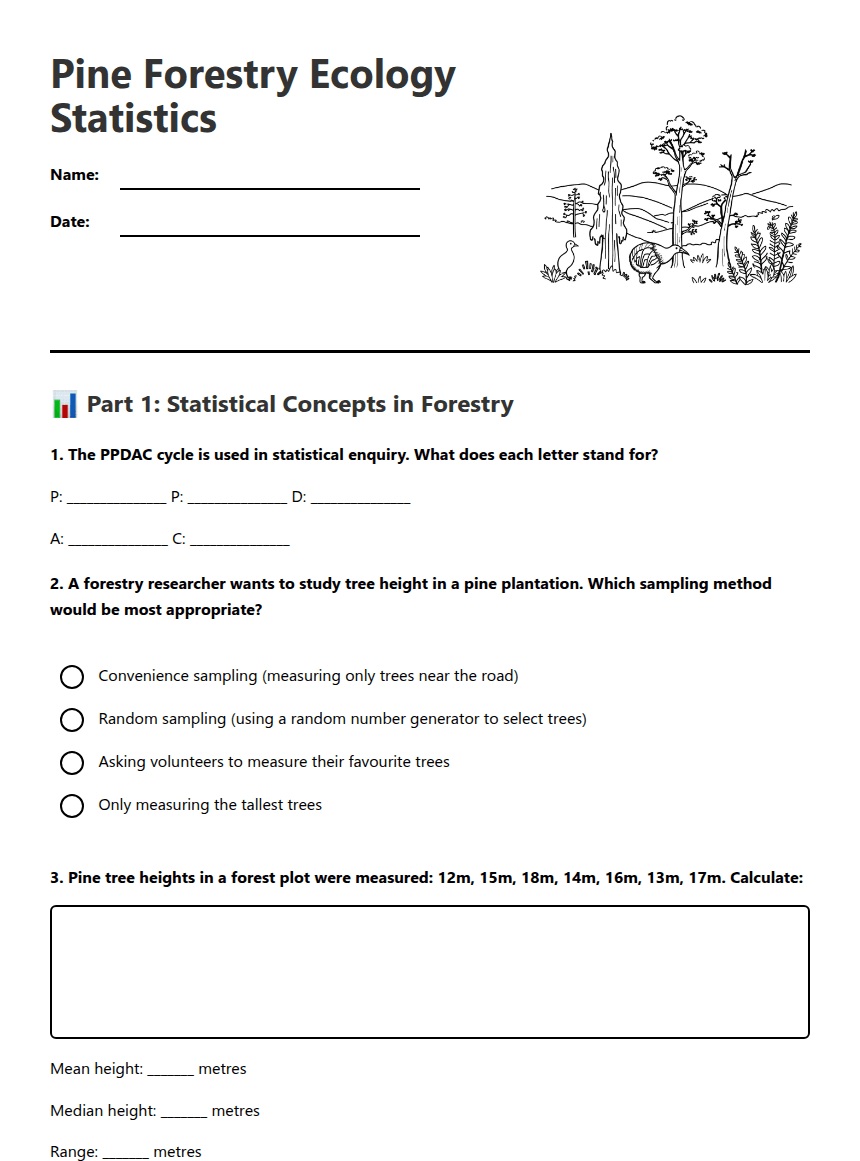
Pine Forestry Ecology Statistics worksheet preview
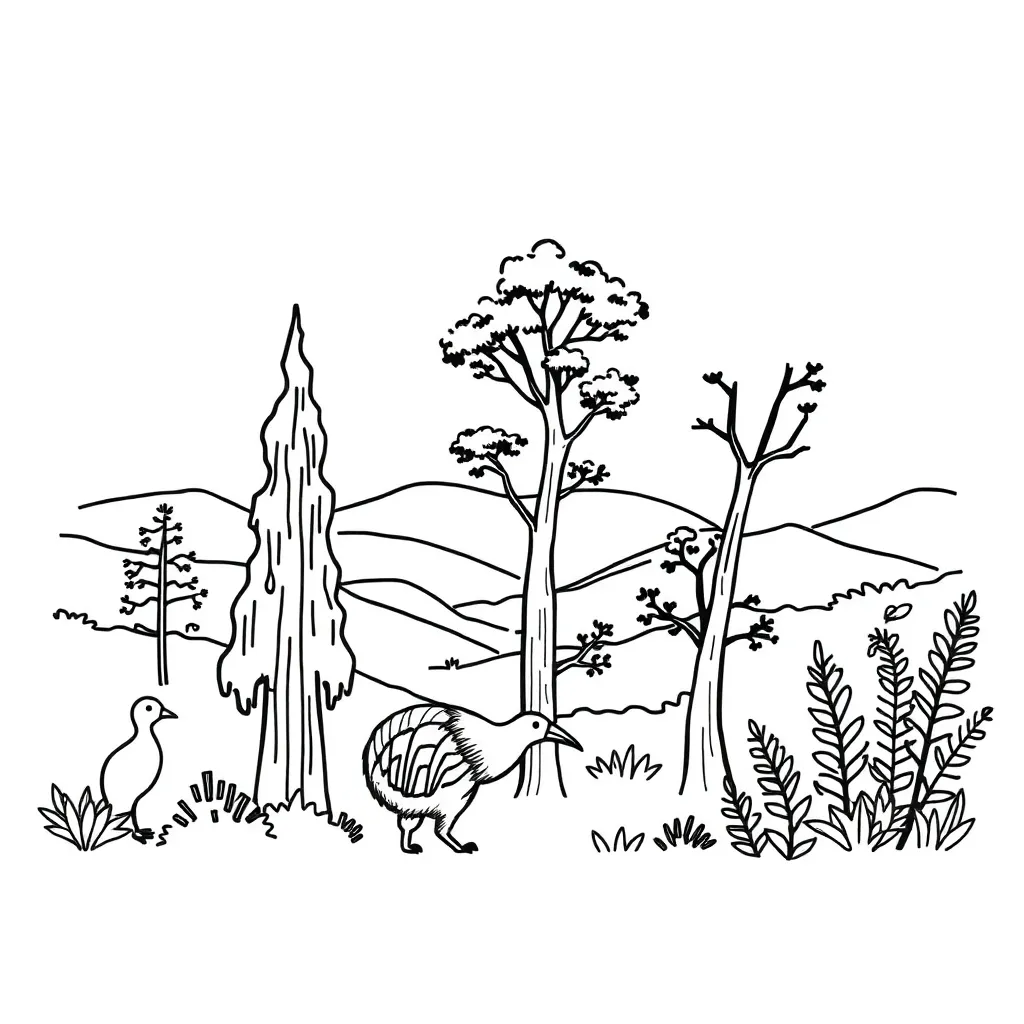
Pine Forestry Ecology Statistics

Pine forest with data charts

📊 Part 1: Statistical Concepts in Forestry

1. The PPDAC cycle is used in statistical enquiry. What does each letter stand for?

P: _______________ P: _______________ D: _______________

A: _______________ C: _______________

2. A forestry researcher wants to study tree height in a pine plantation. Which sampling method would be most appropriate?

Convenience sampling (measuring only trees near the road)

Random sampling (using a random number generator to select trees)

Asking volunteers to measure their favourite trees

Only measuring the tallest trees

3. Pine tree heights in a forest plot were measured: 12m, 15m, 18m, 14m, 16m, 13m, 17m. Calculate:

Mean height: _______ metres

Median height: _______ metres

Range: _______ metres

4. Which measures of centre and spread would be most affected by an unusually tall 35-metre tree in the data above?

Mean

Median

Mode

Range

🌲 Part 2: Ecology and Data Analysis

5. In a pine forest ecosystem study, researchers found these relationships. Complete the food web by filling in the missing organisms:

Pine trees → _____________ → Native birds → _____________

(Hint: Think about what eats pine seeds and what might prey on birds)

6. A forest manager collected data on pine tree survival rates after pest treatment. If 240 out of 300 treated trees survived, what is the probability that a randomly selected treated tree survived?

Probability = _______ (as a fraction) = _______ (as a percentage)

7. Climate change is affecting pine forestry in New Zealand. List two specific threats and suggest one statistical method that could help monitor each threat:
8. A sustainability study shows pine plantation growth rates over 5 years: Year 1: 2.1m, Year 2: 2.8m, Year 3: 3.2m, Year 4: 3.9m, Year 5: 4.1m. Describe the trend and predict the likely height in Year 6:

🔬 Part 3: Applied Problem Solving

9. A forestry researcher wants to investigate whether pine tree height affects seed dispersal distance. Design a simple investigation using the PPDAC cycle:
10. Pine needles have several adaptations for New Zealand's environment. Choose one adaptation and explain how it could be measured statistically in a research study:
11. Reflection: How could the statistical skills you've learned help with sustainable forest management? Give a specific example.

About This Worksheet

Free in Kuraplan

Sign up free, grab the PDF, and customize it for your class.

Print-Ready

Formatted for standard paper. Clean layout, easy to read.

AI-Generated

Created with Kuraplan's AI, designed for real classroom use.

For Teachers & Parents

Use in classrooms, for homework, tutoring, or homeschool.

Need a custom version of this worksheet?

Kuraplan's AI generates custom worksheets in seconds — differentiated for every learner, aligned to your curriculum.

Generate Custom Worksheets — Free
No credit card Curriculum-aligned Under 60 seconds