Population Density Map Reading
A free social sciences worksheet ready for your classroom. Open in Kuraplan to grab the print-ready PDF, customize it for your students, or generate a fresh version in seconds.
Population Density Map Reading
🗺️ Part 1: Map Reading Skills
a) Auckland has a high population density because it is an __________ area.
b) The West Coast of the South Island has a __________ population.
c) Most of New Zealand's population is __________ around major cities.
d) Farming areas typically have __________ populations.
🇳🇿🇦🇺 Part 2: Comparing New Zealand and Australia
New Zealand: _________________________
Australia: _________________________
💭 Part 3: Analysis and Interpretation
About This Worksheet
Free in Kuraplan
Sign up free, grab the PDF, and customize it for your class.
Print-Ready
Formatted for standard paper. Clean layout, easy to read.
AI-Generated
Created with Kuraplan's AI, designed for real classroom use.
For Teachers & Parents
Use in classrooms, for homework, tutoring, or homeschool.
Need a custom version of this worksheet?
Kuraplan's AI generates custom worksheets in seconds — differentiated for every learner, aligned to your curriculum.
Generate Custom Worksheets — FreeMore Social Sciences Worksheets
Map Coordinates Worksheet
Free
Prepare for Natural Disasters?
Free
Our Unique Aotearoa Worksheet
Free
Kiribati Geographic Challenge
Free
Aotearoa Comparisons Worksheet Pack
Free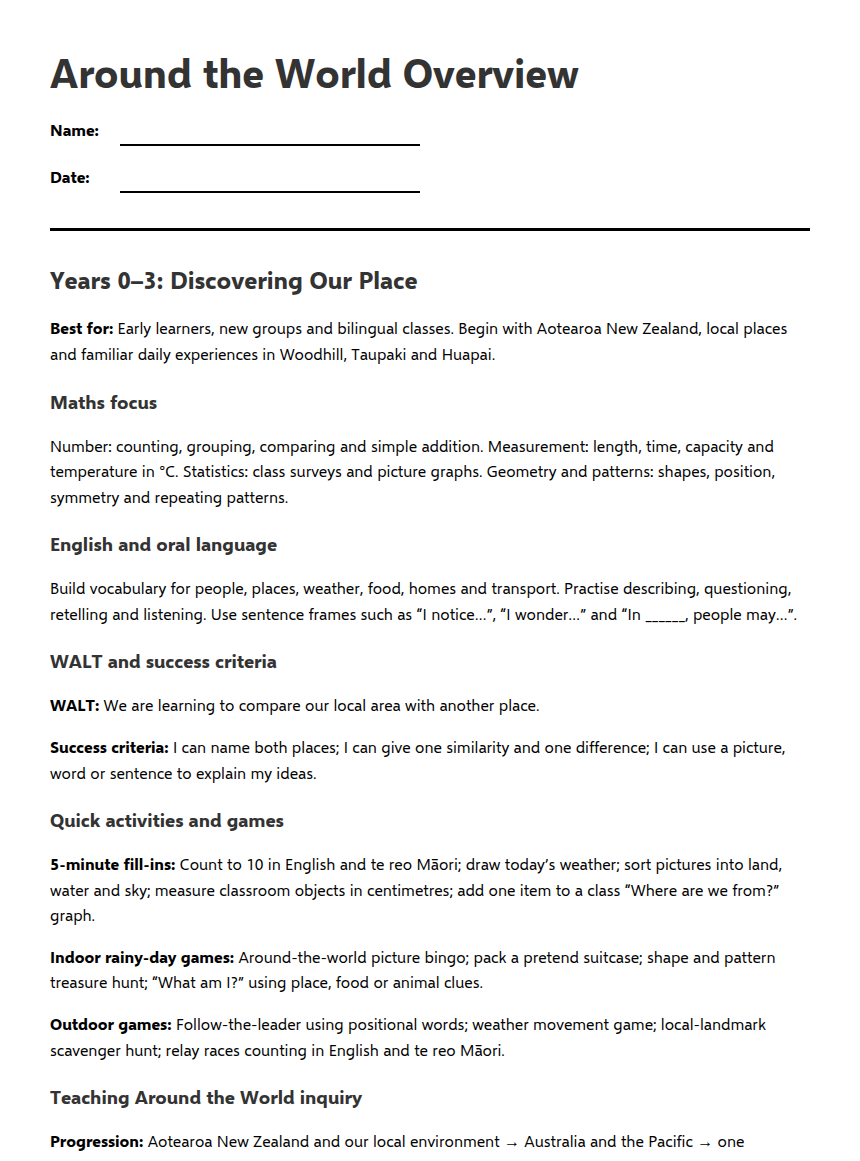
Around the World Overview
Free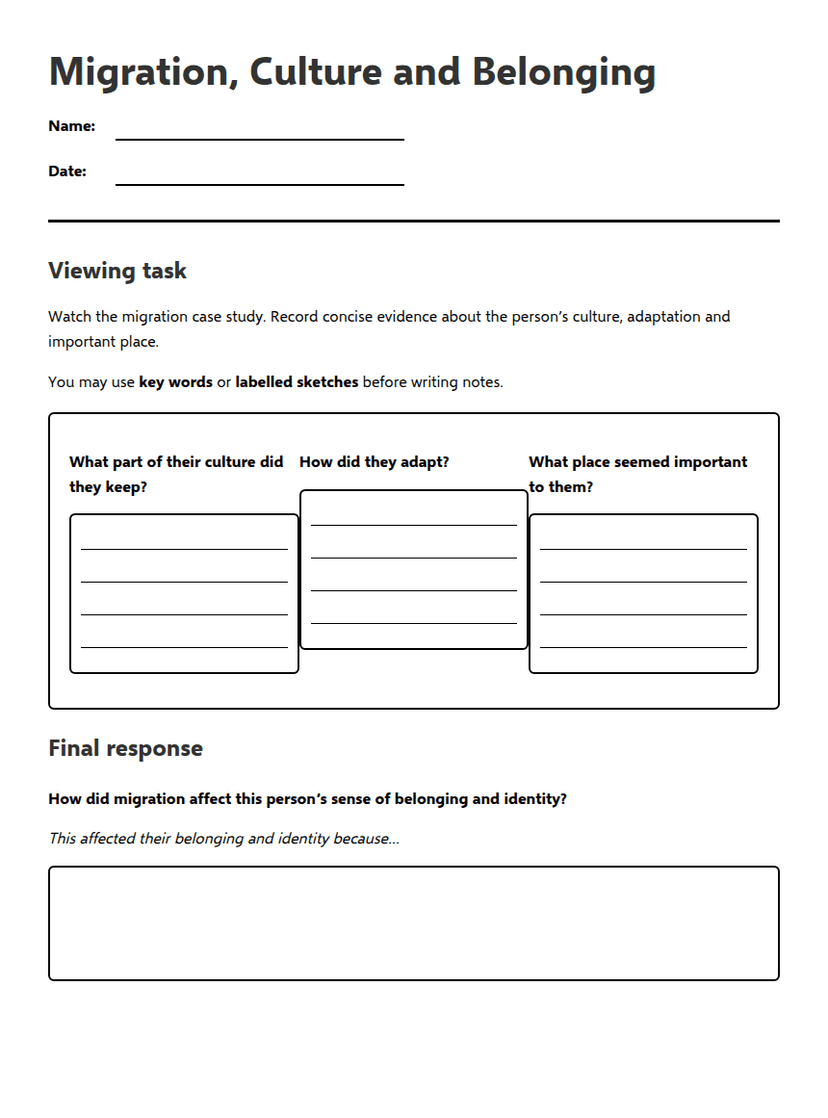
Migration, Culture and Belonging
Free