MathematicsFreePrintable
Weekly Data Bar Graph
A free mathematics worksheet ready for your classroom. Open in Kuraplan to grab the print-ready PDF, customize it for your students, or generate a fresh version in seconds.
Weekly Data Bar Graph
📊 Part 1: Setting Up Your Bar Graph
1. What data will you be tracking each week?
2. What unit of measurement will you use?
Centimetres
Kilograms
Dollars ($)
Number of items
Other: _______________
3. Write a title for your bar graph:
📈 Part 2: Weekly Data Bar Graph Template
Title: ________________________________
Value
100
90
80
70
60
50
40
30
20
10
0
Week 1
Week 2
Week 3
Week 4
Week 5
Week 6
Week 7
Week 8
Week
📝 Part 3: Recording Your Data
4. Record your weekly data in the table below, then draw bars on your graph:
| Week | Data Value |
|---|---|
| Week 1 | |
| Week 2 | |
| Week 3 | |
| Week 4 | |
| Week 5 | |
| Week 6 | |
| Week 7 | |
| Week 8 |
5. Which week had the highest value? _______________
6. Which week had the lowest value? _______________
7. What pattern or trend do you notice in your data?
About This Worksheet
Free in Kuraplan
Sign up free, grab the PDF, and customize it for your class.
Print-Ready
Formatted for standard paper. Clean layout, easy to read.
AI-Generated
Created with Kuraplan's AI, designed for real classroom use.
For Teachers & Parents
Use in classrooms, for homework, tutoring, or homeschool.
Need a custom version of this worksheet?
Kuraplan's AI generates custom worksheets in seconds — differentiated for every learner, aligned to your curriculum.
Generate Custom Worksheets — Free No credit card Curriculum-aligned Under 60 seconds
More Mathematics Worksheets
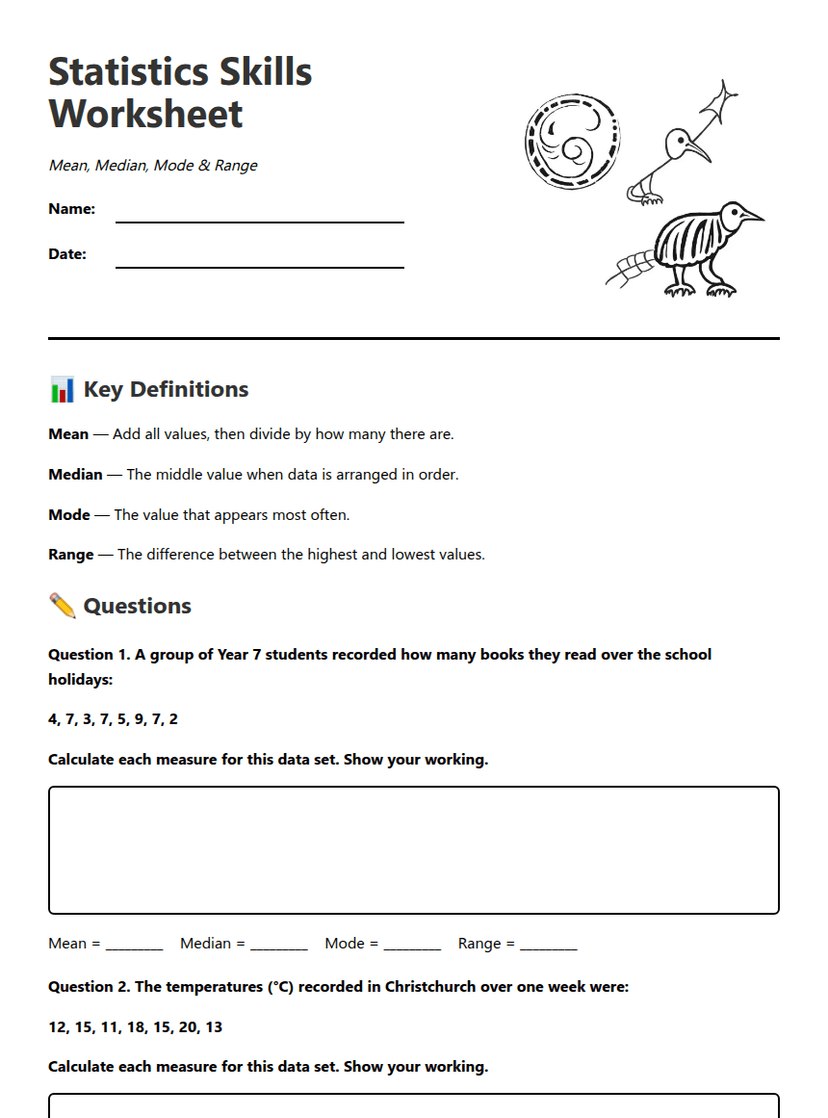
Statistics Skills Worksheet
Free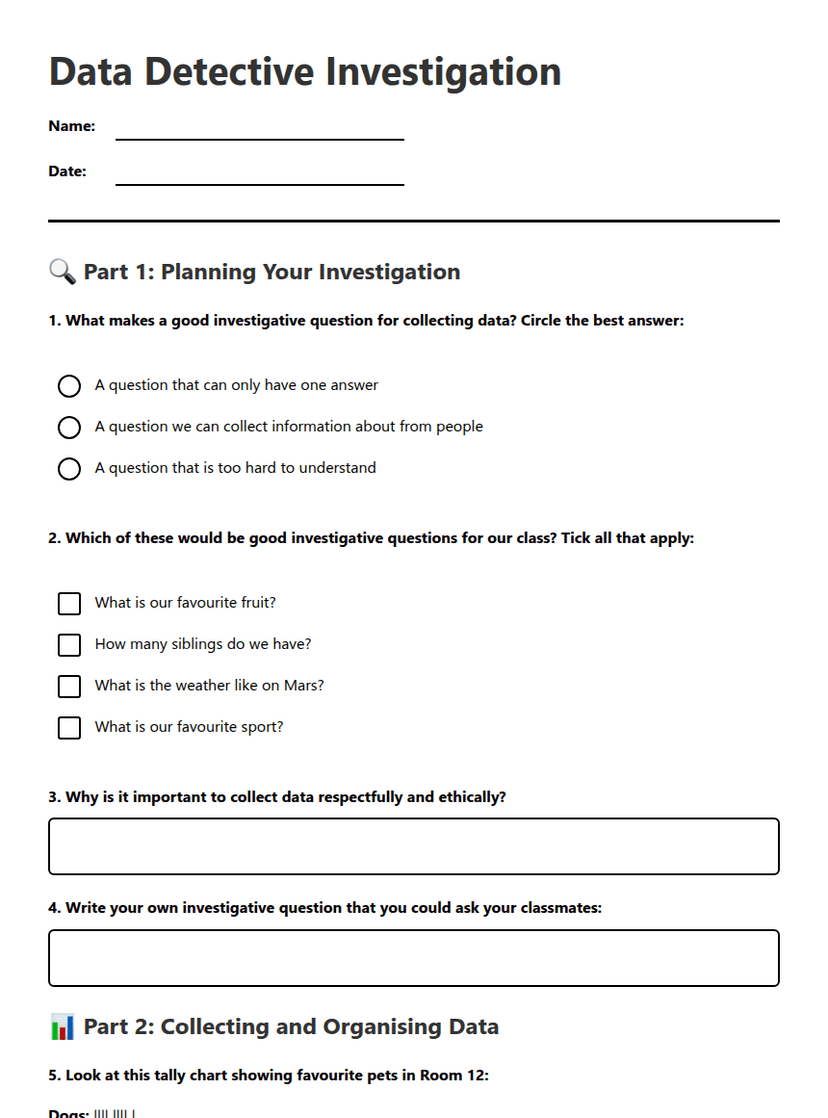
Year 5
Data Detective Investigation
Free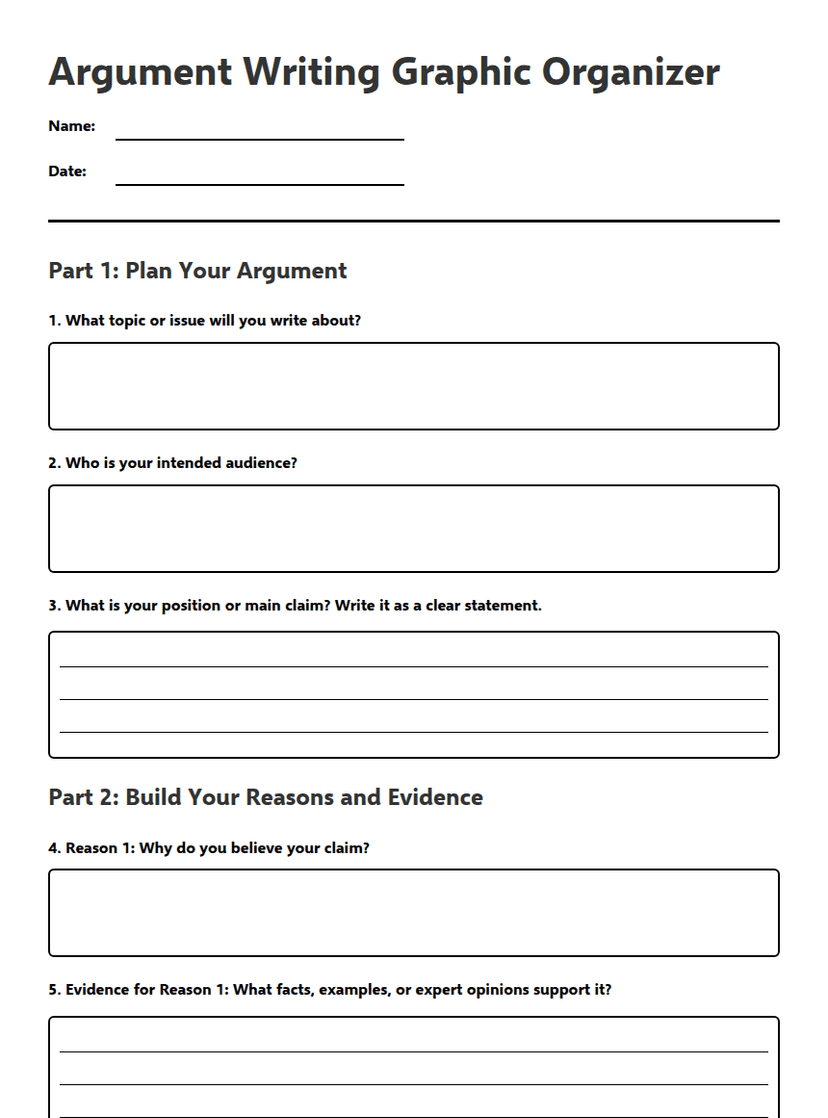
Year 4
Argument Writing Graphic Organizer
Free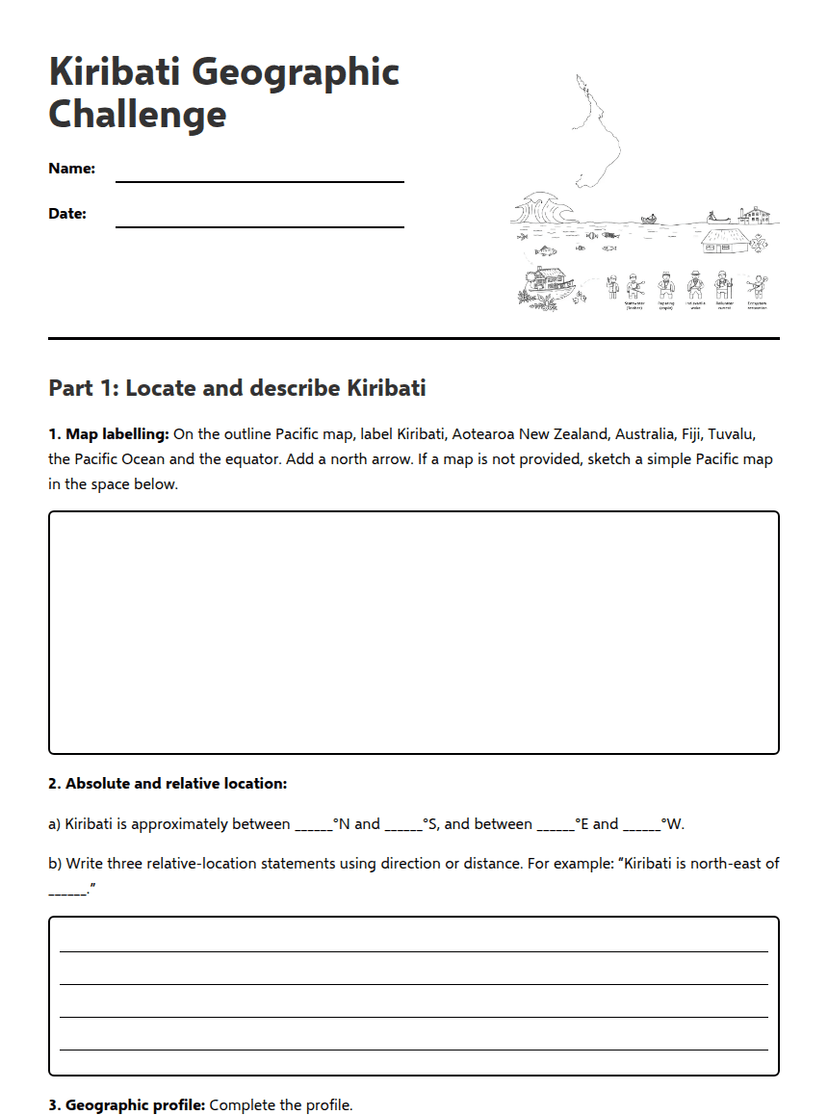
Year 11
Kiribati Geographic Challenge
Free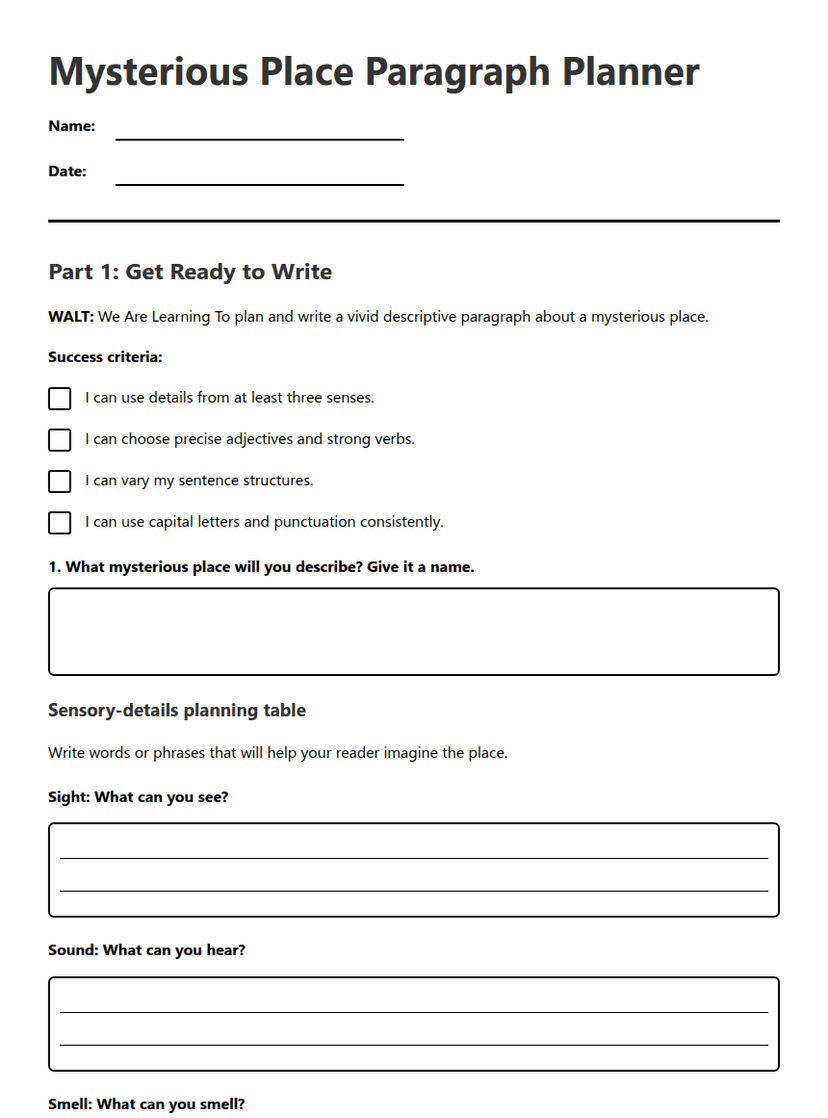
Year 4
Mysterious Place Paragraph Planner
Free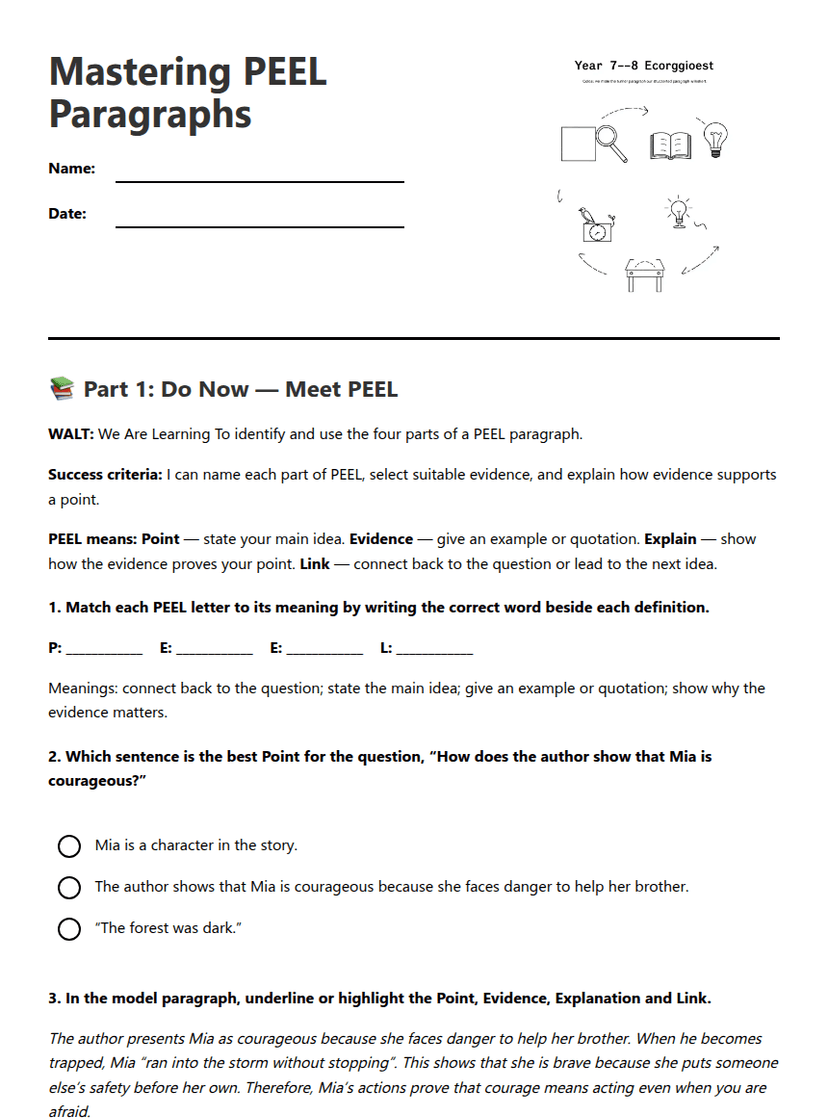
Year 8
Mastering PEEL Paragraphs
Free
Year 10
Pornography and Hauora
Free
Year 10