Averages and Data Interpretation
A free maths worksheet ready for your classroom. Open in Kuraplan to grab the print-ready PDF, customize it for your students, or generate a fresh version in seconds.
Averages and Data Interpretation
📊 Part 1: Calculating Averages from Data Tables
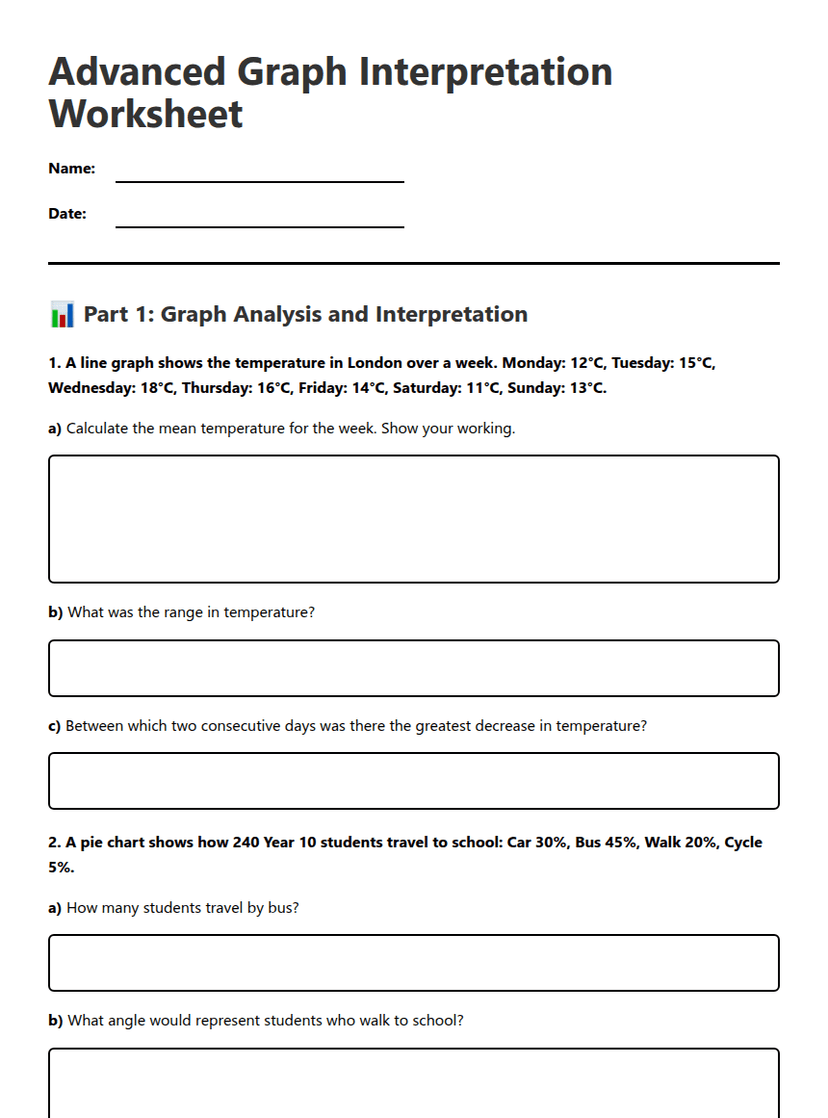
The table below shows the number of goals scored by a football team in their last 10 matches:
Goals scored: 2, 1, 4, 0, 3, 2, 1, 5, 2, 0
Mean = _______
Median = _______
The table shows the heights (in cm) of students in Year 8:
Heights: 145, 152, 148, 155, 150, 147, 153, 149, 151, 146, 154, 150
Mean height = _______ cm
📈 Part 2: Data Interpretation from Charts
The bar chart below shows the number of books read by students in different months:
January: 12 books | February: 15 books | March: 8 books | April: 18 books | May: 10 books
Mean = _______ books
A pictograph shows ice cream sales (each symbol = 5 ice creams):
Monday: 4 symbols | Tuesday: 6 symbols | Wednesday: 3 symbols | Thursday: 7 symbols | Friday: 5 symbols
Total ice creams = _______
Median = _______ ice creams
Saturday sales = _______ ice creams
About This Worksheet
Free in Kuraplan
Sign up free, grab the PDF, and customize it for your class.
Print-Ready
Formatted for standard paper. Clean layout, easy to read.
AI-Generated
Created with Kuraplan's AI, designed for real classroom use.
For Teachers & Parents
Use in classrooms, for homework, tutoring, or homeschool.
Need a custom version of this worksheet?
Kuraplan's AI generates custom worksheets in seconds — differentiated for every learner, aligned to your curriculum.
Generate Custom Worksheets — Free