Discrete Data Diagrams
A free maths worksheet ready for your classroom. Open in Kuraplan to grab the print-ready PDF, customize it for your students, or generate a fresh version in seconds.
Discrete Data Diagrams

📊 Part 1: Understanding Discrete Data
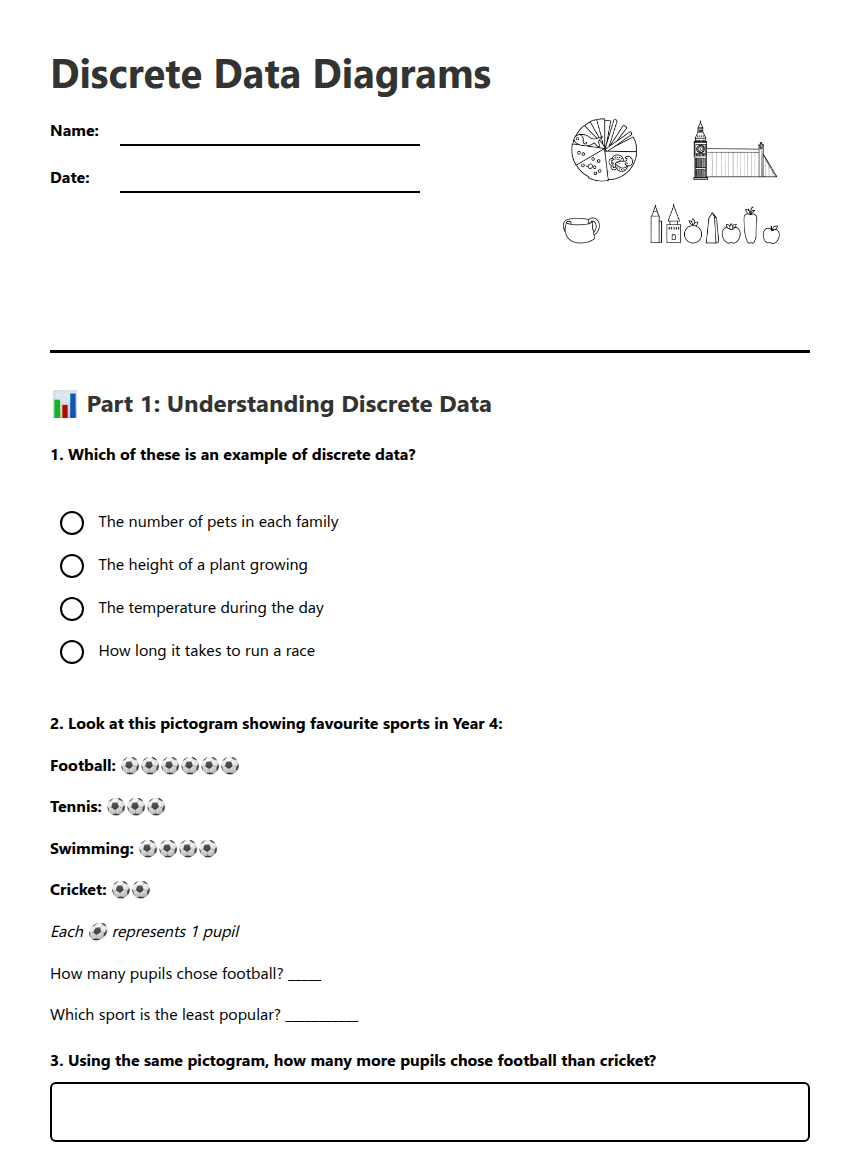
Football: ⚽⚽⚽⚽⚽⚽
Tennis: ⚽⚽⚽
Swimming: ⚽⚽⚽⚽
Cricket: ⚽⚽
Each ⚽ represents 1 pupil
How many pupils chose football? _____
Which sport is the least popular? ___________
📈 Part 2: Reading Bar Charts
(Imagine a bar chart with: Cars = 12, Buses = 3, Bikes = 8, Lorries = 5)
How many cars passed the school? _____
How many bikes passed the school? _____
Which type of vehicle was seen most often? ___________
How many more cars than buses passed the school? _____
What was the total number of vehicles counted? _____
✏️ Part 3: Creating Your Own Data Diagram
Apples: 5 pupils Bananas: 8 pupils Oranges: 3 pupils Grapes: 4 pupils
Create a pictogram below. Use ★ to represent each pupil:
Fact 1: ________________________________________________
Fact 2: ________________________________________________
About This Worksheet
Free in Kuraplan
Sign up free, grab the PDF, and customize it for your class.
Print-Ready
Formatted for standard paper. Clean layout, easy to read.
AI-Generated
Created with Kuraplan's AI, designed for real classroom use.
For Teachers & Parents
Use in classrooms, for homework, tutoring, or homeschool.
Need a custom version of this worksheet?
Kuraplan's AI generates custom worksheets in seconds — differentiated for every learner, aligned to your curriculum.
Generate Custom Worksheets — Free